Fig. 4
Download original image
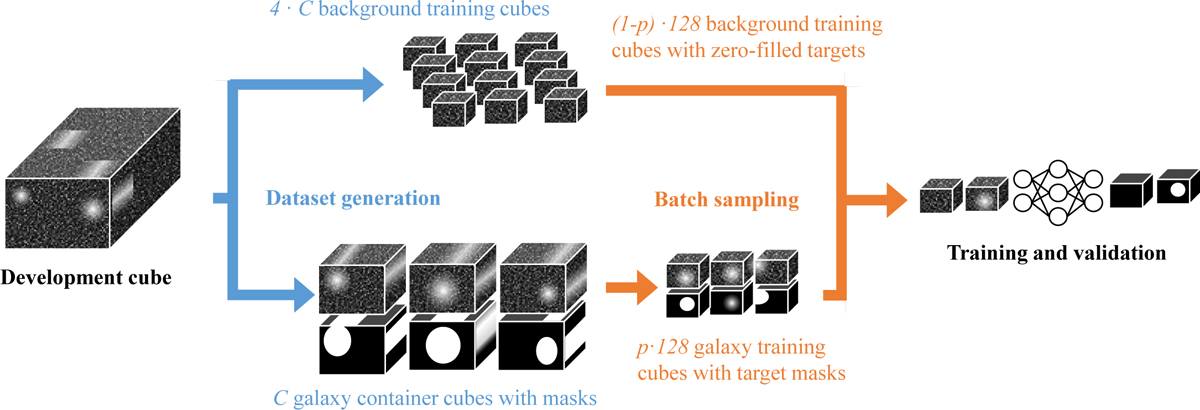
Flowchart of the sampling procedure for training and validation data. The left part, with blue arrows, illustrates sampled data set stored in memory: C galaxy container cubes and 4 C background training cubes. The right part, with orange arrows, illustrates sampling performed during training, resulting in p · 128 galaxy training cubes and (1 − p) · 128 background training cubes.
Current usage metrics show cumulative count of Article Views (full-text article views including HTML views, PDF and ePub downloads, according to the available data) and Abstracts Views on Vision4Press platform.
Data correspond to usage on the plateform after 2015. The current usage metrics is available 48-96 hours after online publication and is updated daily on week days.
Initial download of the metrics may take a while.