Fig. B.1
Download original image
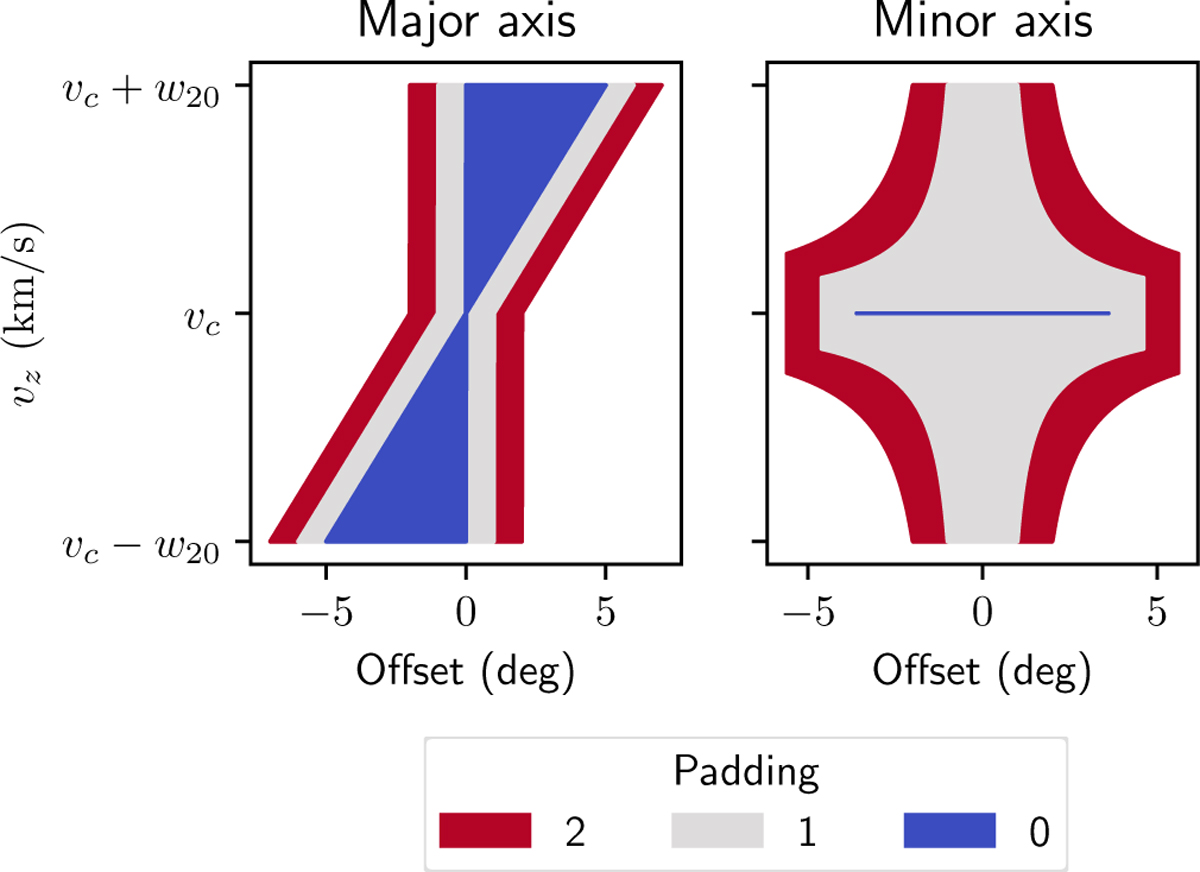
Illustrations of mask occupation for an example galaxy visualized as PV-diagrams, with positional offset from the galaxy center on the horizontal axis and line-of-sight velocity on the vertical axis. The cross-section along the major axis is shown in the left plot and along the minor axis in the right plot. The example galaxy has a major axis S = 10 and inclination i = 45°. The color denotes the occupation for three different levels of padding, including zero padding.
Current usage metrics show cumulative count of Article Views (full-text article views including HTML views, PDF and ePub downloads, according to the available data) and Abstracts Views on Vision4Press platform.
Data correspond to usage on the plateform after 2015. The current usage metrics is available 48-96 hours after online publication and is updated daily on week days.
Initial download of the metrics may take a while.