Fig. 8.
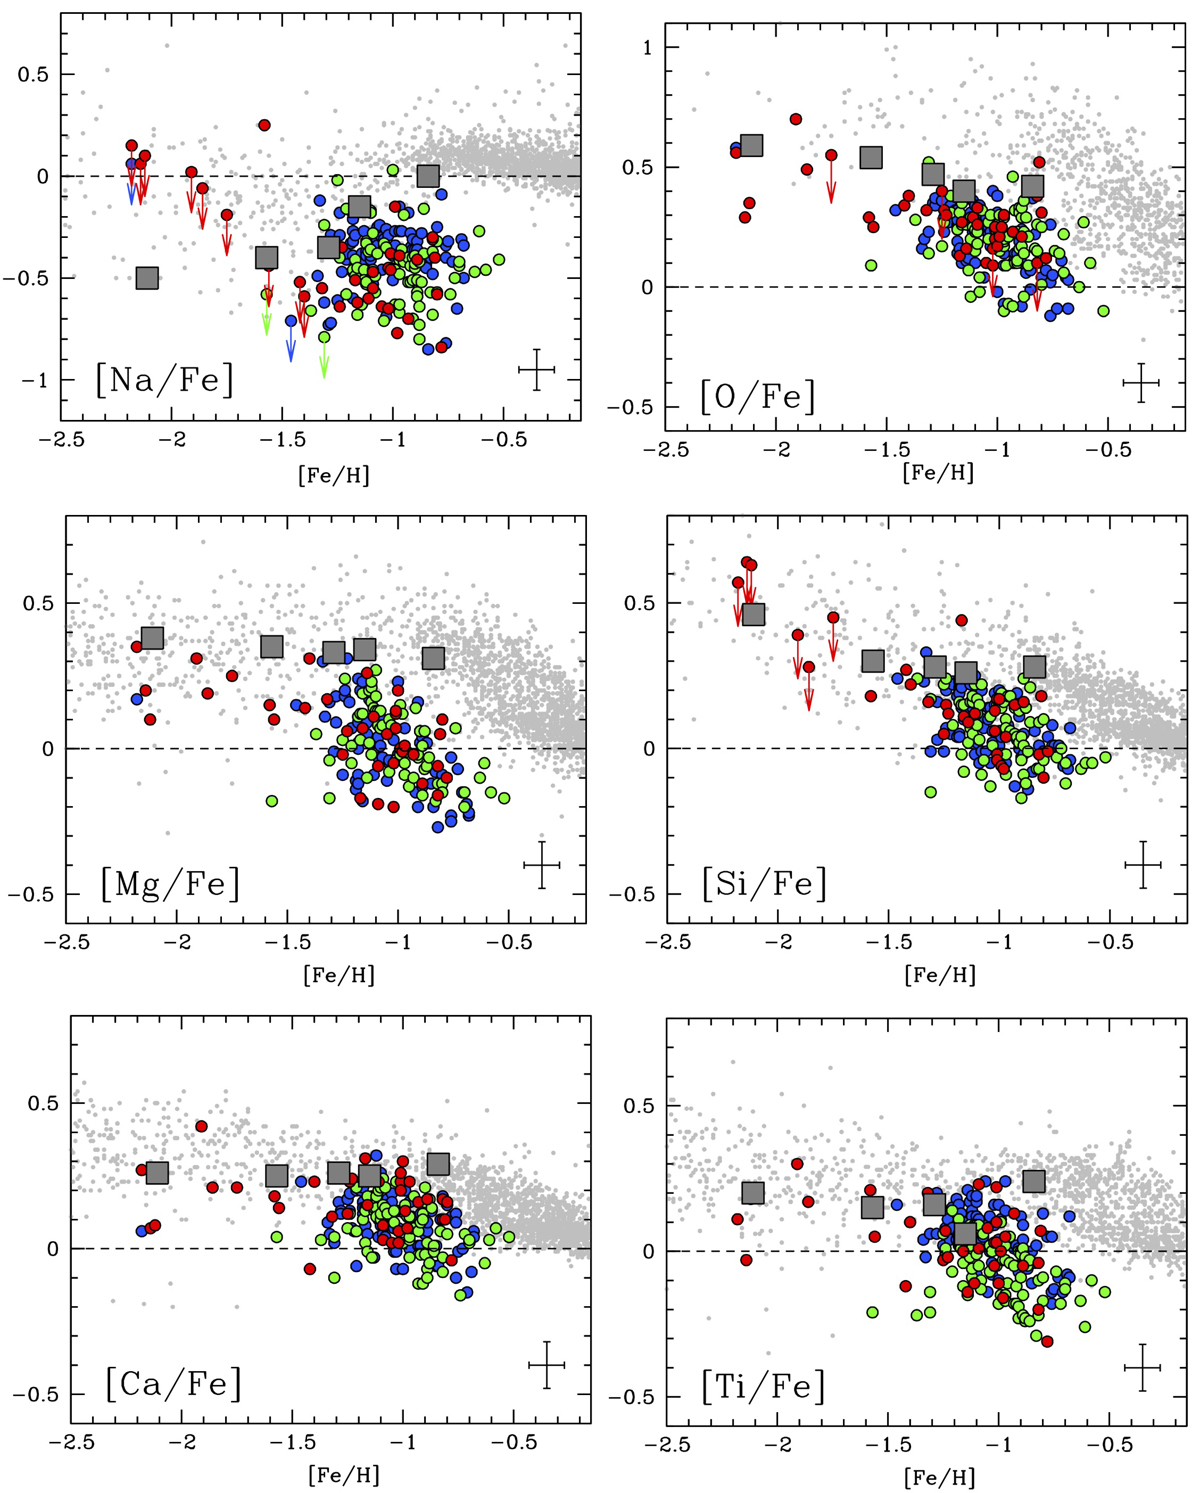
Download original image
Behaviour of the light element [Na/Fe] and α-elements [O/Fe], [Mg/Fe], [Si/Fe], [Ca/Fe], and [Ti/Fe] abundance ratios as a function of [Fe/H] for SMC stars located in the fields FLD-419, FLD-339, and FLD-121 (blue, green, and red circles, respectively). Arrows indicate upper limits. The error bars in the bottom right corner indicate the typical uncertainties. Grey squares are the average values for the five Galactic GCs of the control sample. Abundances of Galactic stars from the literature are also plotted as a reference (Edvardsson et al. 1993; Gratton et al. 2003; Reddy et al. 2003, 2006; Bensby et al. 2005, 2014 for all the elements, Fulbright 2000; Stephens & Boesgaard 2002; Roederer et al. 2014 for Na, Mg, Si, Ca and Ti, Adibekyan et al. 2012 for Na, Mg, Si and Ca, and Barklem et al. 2005 for Mg).
Current usage metrics show cumulative count of Article Views (full-text article views including HTML views, PDF and ePub downloads, according to the available data) and Abstracts Views on Vision4Press platform.
Data correspond to usage on the plateform after 2015. The current usage metrics is available 48-96 hours after online publication and is updated daily on week days.
Initial download of the metrics may take a while.