| Issue |
A&A
Volume 690, October 2024
|
|
|---|---|---|
| Article Number | A38 | |
| Number of page(s) | 8 | |
| Section | Extragalactic astronomy | |
| DOI | https://doi.org/10.1051/0004-6361/202449529 | |
| Published online | 27 September 2024 | |
Extragalactic 85Rb/87Rb and 6Li/7Li ratios in the Small Magellanic Cloud
1
INAF-OAT, Via G.B.Tiepolo 11, Trieste 34143, Italy
2
Institute of Fundamental Physics of the Universe, IFPU, Via Beirut, 2, Trieste 34151, Italy
3
GEPI, Observatoire de Paris, Université PSL, CNRS, 5 Place Jules Janssen, 92190 Meudon, France
4
Department of Physics and Astronomy, University of Notre Dame, 225 Nieuwland Science Hall, Notre Dame, IN 46556 Indiana, USA
Received:
7
February
2024
Accepted:
3
July
2024
Abstract
Aims. The line of sight toward Sk 143 (AzV 456), an O9.5 Ib star in the Small Magellanic Cloud (SMC), shows significant absorption from neutral atoms and molecules. We report a new study of this line of sight by means of high-resolution spectra obtained with the ESPRESSO spectrograph at the VLT of ESO.
Methods. The absorption from neutral and ionized species is well characterized by a single component at vhel ≈ +132 km s−1 that was modeled with the ASTROCOOK code.
Results. The rubidium Rb I 780.0 nm line is detected for the first time outside the Galaxy, and we derive [Rb/H] = −1.86 ± 0.09. As a result of the high resolution, the 85Rb and 87Rb isotope lines are also exceptionally well resolved. The 85Rb/87Rb isotope ratio is 0.46, which is opposite of the meteoritic value of 2.43. This implies that Rb is made through a dominant contribution of the r-process, which is dominant for the 87Rb isotope. We also confirm the presence of 7Li I 670.7 nm and set a limit on the isotopic ratio of 6Li/7Li < 0.1.
Conclusions. The dominance of the 87Rb isotope implies that Rb is made through a dominant contribution of the r-process. At the low metallicity of the cloud of [Zn/H] = −1.28 ± 0.09, neutron rich material may have occurred in rotating metal-poor massive stars. Moreover, the low metallicity of the cloud leads to an absolute Li abundance of A(7Li) ≈ 2.2, which differs from the expectation from big bang nucleosynthesis. Because the gas-phase abundance is not affected by stellar depletion, the burning of Li inside the halo stars is probably not the solution for the cosmological 7Li problem.
Key words: stars: abundances / ISM: abundances / galaxies: abundances / Magellanic Clouds / primordial nucleosynthesis
Corresponding author; This email address is being protected from spambots. You need JavaScript enabled to view it. .
© The Authors 2024
 Open Access article, published by EDP Sciences, under the terms of the Creative Commons Attribution License (https://creativecommons.org/licenses/by/4.0), which permits unrestricted use, distribution, and reproduction in any medium, provided the original work is properly cited.
This article is published in open access under the Subscribe to Open model. This email address is being protected from spambots. You need JavaScript enabled to view it. to support open access publication.
1. Introduction
The formation and evolutionary history of galaxies can be reconstructed by using the information contained in the elemental abundances observed in stars and in the interstellar medium. In this context, isotope ratios are particularly useful because they are produced by different processes in different sources that provide physical information on the role of asymtotic giant branch stars (AGB), novae, and supernovae (Kobayashi et al. 2011). However, the determination of isotopic ratios from quasar spectra requires data with very high quality, and isotopic determinations are only available for a small number of elements and are confined to the Milky Way. On the extragalactic scale, some information has been obtained for the 12C/13C ratio (Levshakov et al. 2006; Muller et al. 2006; Carswell et al. 2011; Welsh et al. 2020). We conduct a first extragalactic study of the 85Rb/87Rb and 6Li/7Li isotopic ratios along the line of sight toward Sk 143 by means of high-resolution spectra acquired with the Echelle SPectrograph for Rocky Exoplanets and Stable Spectroscopic Observations, ESPRESSO, installed at the incoherent combined Coudé facility of the Very Large Telescope of European Southern Observatory (ESO).
Sk 143 (AzV 456) is an O9.5 Ib star in the Small Magellanic Cloud (SMC). The line of sight toward the star is unique in many respects. It shows significant absorption from neutral atoms and molecules at SMC velocities (Cox et al. 2007; Welty et al. 2006; Cartledge et al. 2005), together with a rather strong reddening of E(B − V) = 0.36 or 0.33 (Welty et al. 2012; Jenkins & Wallerstein 2017). It also shows a peculiar Galaxy-type extinction curve that differs from those of other SMC stars. It shows also a rich set of molecules such as C2, C3, CN, and CH, which reveal the presence of a molecular cloud (Welty et al. 2013)
Remarkably, 7Li I 670.7 nm absorption was detected, along with the possible presence of 6Li (Howk et al. 2012). The only other extragalactic detection of Li I was claimed in the spectra of SN2014 in M82, but because this is a transient, it cannot be exploited further for the isotopic ratio (Ritchey et al. 2015).
Rubidium (Rb, Z = 37) is a trace element with a Solar System abundance of Rb/H = 2.8 ± 0.2 × 10⁻¹⁰ as derived from meteorites (Lodders 2021). Earlier interstellar measurements in the Galaxy yielded upper limits (Federman et al. 1985), and the first interstellar detection was made based on observations of two heavily reddened Galactic stars in Cygnus (Gredel et al. 2001). In stellar spectra, the resonance lines of Rb I at 780.0 and 794.7 nm are blended with atomic and/or molecular lines. Rubidium abundances were reported for several stars. They showed that [Rb/Fe] decreases with increasing metallicity, which is consistent with the prediction of chemical evolution models (Takeda 2021; Caffau et al. 2021).
The production of Rb involves neutron capture in both s- and r-processes (Käppeler et al. 2011). The s-process occurs through the main process in the He-shell of low-mass AGB stars and through the weak process in the He- and C-burning layers of massive stars (Shejeelammal & Goswami 2020). García-Hernández et al. (2006, 2009) found high Rb abundances in intermediate-mass AGB stars in the Galaxy and in the Magellanic Clouds. This qualitatively agrees with theoretical models, which predict that intermediate-mass AGB stars synthesize substantial amounts of Rb (van Raai et al. 2012).
7Li I and possibly also 6Li have been detected toward Sk 143 (Howk et al. 2012). Sk 143 is relatively bright, and we made follow-up observations with the aim to significantly reduce the statistical uncertainties in the isotopic determination. Measurements of 7Li I and 6Li in subsolar metallicity environments are quite important to reconstruct their chemical evolutionary curve. 7Li I will help us to understand the cosmological Li problem, while a significant abundance of 6Li could come from α + α fusion by Galactic or pre-Galactic cosmic rays or even from the effects of non-Standard Model particles in the early Universe (Pospelov & Pradler 2010).
2. Observations
Observations of Sk 143 were taken with ESPRESSO, the Echelle SPectrograph for Rocky Exoplanets and Stable Spectroscopic Observations, at the ESO Very Large Telescope. ESPRESSO has two fibres, one fibre for the target and the other for the sky, with a diameter of 140 μm that corresponds to a 1 0 aperture in the sky (Pepe et al. 2021). Twenty-seven observations were performed in service mode with an individual exposure time of about 3150 s. The individual observations are reported in Table 1. The initial mode was 2 × 1 and subsequently 4 × 2 when this became available. In the latter mode, the binning of the CCD was 4 × 2 pixels, that is, 4 pixels binned in the spatial direction and 2 pixels in the spectral direction, read in slow-readout mode. The corresponding resolution was R = λ/δλ ≈ 140 000 for both binnings.
Journal of the observations.
The ESPRESSO Data Reduction Software (DRS), version 3.0, was used for the data reduction. It includes bias and flat-fielding correction, wavelength calibration, and sky subtraction. The wavelength calibration combines a ThAr lamp with a Fabry-Pérot etalon. The sky subtraction used the sky spectrum observed by the second fiber of the instrument. The observations were processed with the ASTROCOOK package Cupani et al. (2020, 2024) to create a single one-dimensional spectrum. ASTROCOOK adopts a drizzling-like technique to combine several exposures without rebinning them individually; the different exposures were equalized to obviate possible discrepancies in the collected flux, and the errors from the DRS were propagated.
We also used archival STIS observations acquired under program 9383 (PI: K. Gordon), which were reported previously (Sofia et al. 2006). The STIS observations were taken with the E140H and E230H gratings using the 0.20″ × 0.09″ apertures with a resolution of R ≈ 114 000.
3. The Sk 143 line of sight
The high-velocity gas in absorption toward Sk 143 shows a heliocentric velocity of 132 as the systemic velocity of the SMC. The hydrogen column density for the SMC component was derived from the Lyα absorption using Hubble Space Telescope (HST)/STIS E140H observations, which provided log N(H 1) = 21.07 ± 0.05 (Howk et al. 2012). The H2 column was derived from FUSE data and provided a total hydrogen column along this sight line of ![Mathematical equation: $ \log N(\mathrm{H}) \equiv \log [N({{\mathrm{H}\,\textsc{i}}})+2N(\mathrm{H_2})] = 21.46\pm0.04 $](/articles/aa/full_html/2024/10/aa49529-24/aa49529-24-eq2.gif) (Cartledge et al. 2005). The gas has a high molecular fraction, with f(H2)≡2N(H2)/N(H) = 0.6. The vhel = 132 km s−1 absorption component is also visible in 21 cm emission, but the 21 cm profile contains a significant amount of gas behind the star with far higher velocities. The SMC is a disrupted galaxy with at least two major bodies: the SMC-Remnant, showing a characteristic velocity of ≈115 km s−1; and the Mini-SMC with velocities of ≈195 km s−1 (Mathewson et al. 1986). However, there are at least two other substructures, one at a radial velocity of ≈ + 134 ± 9 km s−1, as the velocity of the gas seen in front of Sk 143 (see Molaro & Monai 1990 and references therein). This gas belongs to a substructure in between the SMC Remnant, which is in the southeast and not visible in the northwest at the position of Sk 143, and the Mini-Small Magellanic Cloud, which lies behind the star. The 21 cm emission at much higher velocities behind Sk 143 can be associated with the Mini-SMC.
(Cartledge et al. 2005). The gas has a high molecular fraction, with f(H2)≡2N(H2)/N(H) = 0.6. The vhel = 132 km s−1 absorption component is also visible in 21 cm emission, but the 21 cm profile contains a significant amount of gas behind the star with far higher velocities. The SMC is a disrupted galaxy with at least two major bodies: the SMC-Remnant, showing a characteristic velocity of ≈115 km s−1; and the Mini-SMC with velocities of ≈195 km s−1 (Mathewson et al. 1986). However, there are at least two other substructures, one at a radial velocity of ≈ + 134 ± 9 km s−1, as the velocity of the gas seen in front of Sk 143 (see Molaro & Monai 1990 and references therein). This gas belongs to a substructure in between the SMC Remnant, which is in the southeast and not visible in the northwest at the position of Sk 143, and the Mini-Small Magellanic Cloud, which lies behind the star. The 21 cm emission at much higher velocities behind Sk 143 can be associated with the Mini-SMC.
The main absorption features toward Sk 143 at vhel ≈ +132 km s−1 are displayed in Fig. 1, together with the model for the interstellar absorption and the residuals. The absorption lines were modeled using ASTROCOOK (Cupani et al. 2020, 2024). The emission continuum was fit locally in the neighborhood of each absorption feature. A kappa-sigma clipping algorithm was used to iteratively reject the absorbed spectral bins. A Gaussian kernel was applied to the remaining bins to reconstruct the unabsorbed flux level. The results were visually inspected and manually corrected in a few cases by different observers to obtain the final reference continuum. Each Voigt profile was computed using the ionic mass and oscillator strength of the relevant species, and it was optimized for redshift z and logarithmic column density log N, while the Doppler-broadening parameter b was kept constant. The instrumental profile was assumed to be Gaussian. For STIS, we took the nominal STIS resolution from the STIS instrument handbook, namely the resolving power of two pixels, which is equivalent to R = 114 000. For ESPRESSO, the resolving power of the SingleHR 4 × 2 mode was R = 130 000 as measured from the thorium and Fabry-Perot calibration frames (Pepe et al. 2021).
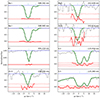 |
Fig. 1. Absorption lines for a representative set of elements toward Sk 143 . The radial velocity correction reported in Table A.1 was applied to the transitions. The data for the lines falling in the optical range were taken from our ESPRESSO observations, and those in the ultraviolet were taken from HST-STIS, the Space Telescope Imaging Spectrograph, acquired under program 9383 (PI: K. Gordon) and reported in Sofia et al. (2006). The blue lines show the continuum, the green line shows the model that provides the best fit to the line absorption, and the red line shows the residuals. |
The absorption from neutral or single-ionised species is well characterized by a single component. The velocity dispersion is the same for heavy or light elements, and therefore, it is dominated by nonthermal motions. We verified that species with large differences in mass could be fit with the same choice of b, showing that the broadening was dominated by turbulence. We obtained the better fit with b = 1.6 km s−1 for S II, Zn II, Mg II, and Na I, while weaker lines were better fit with b = 1.0 km s−1 (which confirms the choice of Howk et al. 2012).
A second component in the Na I lines that is redshifted by about +7 km s−1 with respect to the main component was detected. This second component was also clearly visible in the high-resolution STIS spectra shown in Howk et al. (2012). The column density of this redshifted component is much lower than that of the main component at 132 km s−1 and is not visible in the other trace elements.
In Fig. 1 we show the main absorption features toward Sk 143 in the SMC. The results are provided in Table A.1. The values obtained from Howk et al. (2012) are also reported in Table A.1, and for the elements in common, they agree remarkably well. A more exhaustive list of elements can be found in Howk et al. (2012) and Welty et al. (2016).
Zinc is especially interesting because it is a volatile element and does not condense appreciably on interstellar dust grains, but it closely tracks Fe in Galactic stars. For Zn, we adopted the revised oscillator strength by Kisielius et al. (2015). With the new values, the Zn metallicities are lower by about 0.1 dex than the determinations based on Morton (2003). Since the STIS E230H spectrum is rather noisy, we kept the broadening value fixed at b = 1.6 km s−1, as derived from all the strong lines, and obtained [Zn/H] = −1.28 ± 0.09, which agrees well with the value of [Zn/H] = −1.42 ± 0.33 derived by Tchernyshyov et al. (2015) by means of HST Cosmic Origin Spectrograph observations, and it is slightly below the [Zn/H] = −0.94 ± 0.09 by Jenkins & Wallerstein (2017). This shows that the cloud has a low metallicity. Mucciarelli et al. (2023a) studied hundreds of stars in the SMC by grouping them according to their radial velocities and metallicities. Interestingly, 37 giants form a substructure called FLD-121, which is centered at RA 00:26 and Dec –71:32. This is not far from the position of Sk 143 (RA 01:10 and Dec –72:22). The RV distribution of this stellar structure peaks at RV ≈ +125 km s−1, and the metallicity distribution ranges from −0.8 dex to −2.2 dex; 20% of the stars are more metal poor than −1.5 dex. FLD-121 is quite different from the other structures, which show metallicities about [Fe/H]≈ − 1 and likely formed in the first 1–2 Gyr of the life of the SMC Mucciarelli et al. (2023a). Giants are a potentially different population and are on a different timescale than the gas would probe, but the oxygen abundance in the supergiant Sk 143 was derived by Evans et al. (2004), who found [O/H] < −0.76, which is also consistent with the metallicity of the interstellar cloud derived above, considering that some enhancement in the α elements is expected compared to the iron-peak elements. Thus, it is very likely that the gas seen toward Sk 143 at the heliocentric velocity of ≈132 km s−1 is associated with the metal-poor stellar substructure FLD-121 of the SMC studied by Mucciarelli et al. (2023a).
3.1. Rubidium and 85Rb/87Rb isotope ratio in the interstellar medium of the Small Magellanic Cloud
The analysis of the Solar System abundances in meteorites provides estimates of the fractional abundances of the isotopes 85Rb and 87Rb and of the main formation processes. The Solar System 85Rb is composed of about 35% s- and 65% of r-process. The weak s-process makes up about 30 % of the s-process contribution (Federman et al. 2004). For Solar System 87Rb, the fractions are inverted: about 70% is composed of s- and about 30% of r-process. For this isotope, only a minor contribution comes from the weak s-process. Rb is a neutron densitometer because of its role as a branch in the s-process path (Lambert et al. 1995). Low neutron densities favor 85Rb through the sequence 84Kr(n, γ)85Kr(β)85Rb, while high neutron densities favor 87Rb through the sequence 84Kr(n, γ)85Kr(n, γ)86Kr(n, γ)87Kr(β)87Rb. As a result of the different relative contributions of the s- and r-processes to the two isotopes, a measurement of the Rb isotope ratio is a clue to the history of heavy-element nucleosynthesis.
The Rb I spectrum for the interstellar gas toward Sk 143 is displayed in Fig. 2. The appearance of three components arises from the 62 mÅ hyperfine splitting in 85Rb combined with the hyperfine component in 87Rb. The Rb I lines were fit to extract column densities for the isotopes 85Rb and 87Rb. The relevant atomic data we used for input (Morton 1991, 2000) and the resulting column densities (N) are given in Table A.1. The N(Rb I) column density is = 9.96 ± 0.08. With log N(H) = 21.46 ± 0.04, its abundance becomes [Rb/H] = −1.86 ± 0.09 without a correction for ionization. Insights into the absolute Rb abundance can be obtained through a comparison with potassium. The K I abundance is obtained from the K I 404.414 nm shown in Fig. 1. We derived a logarithmic N(K I) column density of 12.57 ± 0.1, which agrees well with the 12.61 ± 0.0.2 derived by Howk et al. (2012), but the error is slightly larger, and with the 12.65 ± 0.1 derived by Welty et al. (2016). Rb I and K I are trace interstellar species, and corrections for ionization are required to estimate the elemental abundances. The ionization potentials for Rb I and K I are similar, 4.18 and 4.34 eV, respectively, and the depletion factors can be assumed to be similar for alkali metals (Welty & Hobbs 2001; Knauth et al. 2003). The Ag(Rb)/Ag(K) ratio is given by
 (1)
(1)
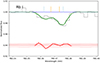 |
Fig. 2. Spectrum of Sk143 around the Rb I 780.0 nm line. The positions of the hyperfine splitting of 85Rb (orange) and 87Rb (light blue) are indicated, and the green line shows the model. |
where G(X) are the photoionization rates and α(X) are the rate coefficients for radiative recombination. Following Federman et al. (2004), the photoionization rates for Rb I and K I are 3.42 × 10⁻¹² and 8.67 × 10⁻¹² s−1, respectively, and  . The radiative recombination coefficients of Rb and K are about the same, and therefore, the ratio
  is ≈1. Thus, from a measured
  toward Sk 143, we obtain a relative abundance of Ag(Rb)/Ag(K) = 0.4 ± ×10−3. This is lower than the solar value of 2.1 ± 0.2 × 10⁻³, or equivalently, [Rb/K] = −0.7 (Lodders 2021). It is also lower than that of the interstellar gas toward ρ Oph A of (1.3 ± 0.3)×10−3 and in the two components toward Cyg OB2 of 1.4 × 10⁻³ and 1.2 × 10⁻³ (Federman et al. 2004). Because K traces Fe quite well, this result suggests an intrinsic deficiency of Rb in the cloud in front of Sk 143 in general.
Rubidium has seldom been investigated in stars because it requires access to the near-infrared, and the spectral range is contaminated by telluric absorption lines that may or may not be blended with the stellar lines, depending on the observed radial velocities of the stars. Rubidium abundances were reported for 19 stars in the metallicity range −2.8 < [Fe/H]< 0 (Gratton & Sneden 1994) and for 44 giants and dwarfs in the range of −2.0 < [Fe/H]< 0.0 (Tomkin & Lambert 1989). These studies showed that [Rb/Fe] tends to be moderately supersolar, 0 ≲ [Rb/Fe]≲0.5, in the metal-poor regime ([Fe/H]≲ − 1) (Lambert et al. 1995). At variance with these findings, Abia et al. (2020) found [Rb/Fe] ratios slightly subsolar by ≈−0.3 dex at low metallicities. However, recent studies confirmed that [Rb/Fe] increases with the decrease in metallicity, which is consistent with the prediction of chemical evolution models (Takeda 2021; Caffau et al. 2021). D’Orazi et al. (2013) found solar ratios of [Rb/Fe]≈0 in a few globular clusters with metallicities [Fe/H]≈ − 1.5.
The 85Rb/87Rb isotope ratio toward Sk 143 is found to be 85Rb/87Rb = 0.46. This value differs significantly from the meteoritic value of 85Rb/87Rb = 2.430 (Lodders 2021) and also from the value measured in the Galactic interstellar medium toward ρ Oph A and HD 169454 of 85Rb/87Rb = 1.21 and > 2.4, respectively (Kawanomoto et al. 2009a). This suggests a different importance of r and s-processes, which leads to the Rb isotopes between the MW and the cloud toward Sk 143. The observed isotopic difference can be obtained either with a lower abundance of 85Rb or with a higher 87Rb abundance relative to the abundances in meteorites. However, the Rb abundance with respect to potassium can be used to determine which of the two possibilities is true (Federman et al. 2004). Toward Sk 143, we find 85Rb/K = 0.6 × 10⁻³ and 87Rb/K = 2.0 × 10⁻³. The Solar System ratios are 85Rb/K = 1.38 ± 0.14 × 10⁻³ and 87Rb/K = 0.69 ± 0.06 × 10⁻³ (Lodders 2021). The comparison shows that 85Rb is underabundant in the gas toward Sk 143 by a factor of about two, and 87Rb is overabundant by about a factor of four with respect to the Solar System abundances.
Theoretical models indicate that 87Rb mainly arises from the r-process (Arlandini et al. 1999; Raiteri et al. 1993). We are led to infer that the higher interstellar abundance for 87Rb is due to an r-process synthesis in the stars that enriched the interstellar gas seen along the line of sight of Sk 143.
The relatively low Rb abundance relative to iron suggests a different nucleosynthesis, and the r-process that occurs in rotating massive metal-poor stars seems a suitable candidate (Limongi & Chieffi 2018; Choplin et al. 2018; Banerjee et al. 2019). These models show that fast rotation boosts the r-process. Rotation-induced mixing results in primary production of 13C. The presence of 13C has been established at low metallicities (Molaro et al. 2023). 13C provides neutrons via 13C(α, n)16O during core He burning. In the models of Limongi & Chieffi (2018) for a 20 M⊙ star with a rotational velocity ≥150 km s−1 and [Fe/H]≤ − 1.0, 87Rb dominates 85Rb. Depending on the rotation speed and the mass-loss rate, a strong r-process can occur that produces elements up to bismuth for progenitors with low metallicities (Banerjee et al. 2019). This result suggests that rapidly rotating massive metal-poor stars can potentially explain the early onset of the r-process we observed in the metal-poor cloud toward Sk 143.
3.2. Lithium and 6Li/7Li isotopic ratio in the interstellar medium of the Small Magellanic Cloud
Howk et al. (2012) detected the interstellar neutral lithium line at 670.7 nm toward Sk 143 and derived a column density of log N(7Li) = 10.29 ± 0.02 and an isotopic ratio of 6Li/7LiSMC = 0.13 ± 0.05 with a marginal detection of 6Li. The ESPRESSO Li I region toward Sk 143 is shown in Fig. 3. The estimate of the 6Li/7Li relies on simultaneously fitting the hyperfine structure of the 7Li I and 6Li absorption. The wavelengths for the hyperfine levels were adopted from Sansonetti et al. (1995). The stellar continuum in the region around Li I is featureless and was well fit. In the profile-fitting process, we allowed variations in the parameters of the continuum during the minimization process. This allowed us to estimate the uncertainties caused by the continuum fitting into the final error budget. Because the absorption is so weak, the b-value has a minor effect on the precision of the column density determination. We derive log  and log N(6Li) < 9.30 at 3σ C.L.
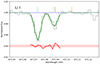 |
Fig. 3. Spectrum of Sk143 around the Li I resonance doublet at 670.7 nm. The isotope of 7Li I is plotted in light blue and 6Li in orange. |
3.2.1. 6Li
6Li is not expected to be produced in measurable amounts in BBN (Pospelov & Pradler 2010). On the other hand, both 7Li and 6Li are directly synthesized in the ISM through cosmic-ray interactions with interstellar medium (ISM) particles, either through spallation or α + α fusion. These are the only sources for 6Li post-Big Bang production. A few years ago, (≥2σ) 6Li detections were reported in nine stars over a metallicity range of −1.25 < [Fe/H]< − 2.74. The stars showed a uniform 6Li/7Li ratio as a function of metallicity (Asplund et al. 2006). These observational determinations imply a primordial production of 6Li and no destruction of 7Li inside of the stars because stellar interiors destroy 6Li more efficiently than 7Li. However, convective processes generate an excess of absorption in the red wing of the 7Li I absorption profile that could be interpreted as 6Li (Cayrel et al. 2007). The reliability of the 6Li plateau was further called into question with a Non-local Thermodynamic Equilibrium analysis and new high-quality observations (Lind et al. 2013; Wang et al. 2022).
Toward Sk 143, we derive (6Li/7Li)SMC < 0.1. The isotopic ratio is not affected by ionization or dust-depletion effects, and the limit is robust. The value is consistent with the value for the Solar System, (6Li/7Li)⊙ = 0.0787 ± 0.0004, and with the (6Li/7Li)MW = 0.13 ± 0.04 derived for the Milky Way ISM by Kawanomoto et al. (2009b). For standard energy distributions of Galactic cosmic rays, 7Li and 6Li isotopes are produced in a ratio (6Li/7Li)CR ≈ 0.67 (Steigman & Walker 1992). Thus, our upper limit for the (6Li/7Li)SMC imposes a stringent upper bound of < 20% to the fraction of the 7Li detected in the SMC toward Sk 143 that could have been produced via cosmic-ray spallation processes.
3.2.2. 7Li
Determinations of the 7Li abundance in interstellar environments with subsolar metallicities provide a method of constraining the cosmic evolution of 7Li that is not affected by the uncertainties that hamper stellar 7Li abundance studies. The interstellar studies have the potential to provide insights into the well-known discrepancy between the primordial 7Li abundance predicted by standard Big Bang nucleosynthesis and the 7Li abundance observed in the atmospheres of metal-poor Galactic halo stars (Sbordone et al. 2010; Matas Pinto et al. 2021), the so-called Spite plateau (Spite & Spite 1982a,b). The value of Li produced in the primordial nucleosynthesis mainly depends on the cosmic baryon-to-photon ratio, which can be inferred from the measured primordial deuterium abundance or from observations of the cosmic microwave background. The current primordial 7Li I abundance from BBN plus CMB is A(7Li)≡log[N(7Li)/N(H)] + 12 = 2.69 ± 0.14 (Yeh et al. 2021), A(7Li) = 2.74 ± 0.17 (Pitrou et al. 2021) and A(7Li) = 2.66 (Consiglio et al. 2018). These estimates are significantly higher than the most recent determination of the Li plateau value in the halo stars of A(7Li) = 2.16 ± 0.07 by Matas Pinto et al. (2021). This discrepancy could be due to the depletion of stellar lithium abundances or to new physics that were effective in the early Universe.
In the interstellar medium, the derivation of the absolute 7Li abundance is complicated by the combined effects of ionization and dust grain depletion. In diffuse clouds, the neutral lithium is a trace species, and the dominant ionization state of 7Li is 7Li II, which is not observable. Thus, the observed abundance requires a large correction for ionization. However, since Li I and K I respond in a similar way to ionization and depletion conditions, the Li/K ratio can be used to estimate the amount of photoionization and depletion corrections that are required to infer the absolute 7Li abundance (Welty & Hobbs 2001; Knauth et al. 2003; White 1986). The absolute A(7Li) abundance can be derived through the equation
![Mathematical equation: $$ \begin{aligned} A(^7\mathrm{Li})_{\mathrm{SK143}} = A(^7\mathrm{Li})_{\odot } + [\mathrm{K/H}]_{\mathrm{SK143}} + [^7\mathrm{Li/K}]_{\mathrm{SK143}}. \end{aligned} $$](/articles/aa/full_html/2024/10/aa49529-24/aa49529-24-eq8.gif) (2)
(2)
Along the sight lines through the Milky Way  is found nearly constant, and the ratio is about −2.27 (Steigman 1996; Welty & Hobbs 2001). The constancy of the ratio in the Galaxy shows that 7Li and K must have very similar ionization and dust depletion behaviors in different environments of the Milky Way. Since the solar system is
  Li is more depleted than K with a differential ionization correction of log [(Γ/αr)Li/(Γ/αr)K]= + 0.54 ± 0.08 (Steigman 1996; Welty et al. 2003). This ionization correction assumes a temperature of T = 100 K, although the ratio of the recombination coefficients is not very sensitive to T for the species we considered (Pequignot & Aldrovandi 1986). Our measured value of log N(7Li I)/N(K I) = −2.31 ± 0.02 implies log N(7Li)/N(K) = −1.77 ± 0.08 after correction for the differential ionization. With the Solar System value of log (7Li/K)⊙ = −1.84 ± 0.05, we obtain [7Li/K]≡log N(7Li)/N(K) − log (7Li/K)⊙ = +0.07 ± 0.08.
The potassium abundance can be deduced from the zinc abundance in the same cloud assuming they both track iron closely. Zn II and S II are in their dominant stage, and neither are depleted, or are depleted only very little, into dust grains. However, observations show a mild overabundance of [K/Fe] ≈ 0.1 at [Fe/H] = −1 when Non-local Thermodynamic Equilibrium effects are taken into account for the 769.8 nm line (Reggiani et al. 2019; Takeda 2019).
Thus, assuming [Zn/Fe] = 0 and allowing a mild overabundance in [K/Fe] = 0.1 from [Zn/H]143 = −1.28 ± 0.06, we obtain a value of [K/H]143 ≈ −1.18 for the potassium abundance in the cloud. This is also consistent with the measured sulphur abundance of [S/H] = −0.72 ± 0.11, considering that sulphur is an alpha-element and is overabundant by about 0.5 dex with respect to iron-peak elements at these metallicities (see e.g. Perdigon et al. 2021; Lucertini et al. 2022 and references therein). In addition, the nature of Zn is not fully understood. While Zn is often observed to track Fe, at low metallicities, ([Fe/H] < −0.5) [Zn/Fe] appears to be constant and slightly supersolar (Duffau et al. 2017). When [Zn/Fe] is supersolar, it decreases the derived iron abundance in the cloud, and therefore, it also decreases the potassium and lithium abundances. With a solar Li abundance of A(Li)⊙ = 3.27 ± 0.03 (Lodders 2021), Eq. (2) becomes
 (3)
(3)
 (4)
(4)
The value is closer to the Li value observed in the halo stars rather than the BBN+CMB value. De Cia et al. (2024) estimated the metallicity of the material toward Sk 143 by considering several elements and including the effect of the presence of dust. They derived a total metallicity of [M/H]= − 1.09 ± 0.24, which assumes that [K/H] = [M/H] provides an absolute lithium abundance of A(Li) = 2.25 ± 0.25. Howk et al. (2012) took the K abundance from stellar determinations, which is higher by about 0.7 dex, taken from the stars, and therefore, computed a much higher value of A(7Li). The metallicity distribution of stars belonging to the field FLD-121, like the gas toward Sk 143, shows a clear lack of relatively metal-rich stars with [Fe/H] between −0.8 and −0.5 dex and peaks at ≈−1.1 (Mucciarelli et al. 2023a). It is also important to note that at these metallicities, no significant stellar production of Li is expected in the SMC in the detailed models by (Izzo et al. 2022), which are based on 7Be detection in two SMC novae. A measured value about A(7Li) ≈ 2.2 is a quite universal value in old stars of the Galactic halo, in the metal-poor stars belonging to the accreted galaxy of Gaia-Sausage-Enceladus (Molaro et al. 2020), and in the stars of the Sagittarius galaxy (Mucciarelli et al. 2014) and ω Cen (Monaco et al. 2010), which is very likely the core of a disrupted galaxy. This strongly suggests that the Spite plateau is universal, as is the cosmological lithium problem, namely the discrepancy between observed Li and the predictions of standard Big Bang nucleosynthesis. The generally favoured solution of this problem involves Li depletion by several mechanisms in the stellar atmospheres (see Fields & Olive 2022 for a recent discussion). However, while the theory of turbulent diffusion (Richard et al. 2002, 2005; Borisov et al. 2024) may be invoked to explain this discrepancy in stars, it cannot have any effect on the 7Li as measured in low-metallicity interstellar gas, and our measurement in metal-poor gas toward Sk 143 in the SMC challenges the stellar depletion solution. Some alternative solutions with new physics are described in Mathews et al. (2020).
4. Conclusions
Based on spectrum with a high resolution and high signal-to-noise ratio obtained with the ESPRESSO spectrograph, we searched for the presence of rare elements in the gas along the line of sight of the star Sk 143 in the SMC. The absorbing gas was observed at a heliocentric velocity of 131 km s−1 and originated in a low-metallicity substructure of the SMC (Molaro & Monai 1990; Mucciarelli et al. 2023b). This search led to the main findings we list below.
-
The resonance lines of Rb were detected outside the Galaxy for the first time. Furthermore, the lines of the two isotopes 85Rb and 87Rb were resolved. The isotopic ratio is the opposite to the ratio that is observed in the Galaxy. By using potassium as a reference, we showed that the observed ratio is due to an enhancement of 87Rb and to a deficit of 85Rb. This suggests that the r-process dominates in the synthesis of rubidium. Using Zn as a proxy for Fe, we derived [Rb/Fe] = −0.55. This is lower than that observed in the Galaxy and than what is expected in the SMC stars. These two anomalies favor the possibility that r- elements are produced in metal-poor rotating massive stars (Limongi & Chieffi 2018; Banerjee et al. 2019).
-
No evidence was found of the presence of the 6Li isotope. The upper bound is slightly below the marginal detection of Howk et al. (2012).
-
The presence and abundance of 7Li was found to agree with Howk et al. (2012). However, we measured the metallicity of the cloud with zinc and found [Zn/H] = −1.3, which agrees with the metallicities of the stars of the SMC component that show the same radial velocity (Mucciarelli et al. 2023a). This leads to an absolute lithium of A(7Li)≈2.2, which is about the value measured in warm-halo dwarf stars. This suggests that the solution of the cosmological Li problem cannot be ascribed to stellar depletion.
The line of sight toward the hot star Sk 143 in the Small Magellanic Cloud proves to be unique because it offers the possibility of studying the abundance of elements that are inaccessible to extragalactic investigations. In particular, it offers insight into the values of isotopic ratios in a low-metallicity environment, which provides unique information on the processes of their chemical synthesis and evolution.
Acknowledgments
The entire ESPRESSO team is gratefully thanked for having built a high quality and precise instrument. We also thank the ESO staff for having assisted and conducted the observations in service mode with great professionalism. Stimulating discussions with Marco Limongi, Serrgio Cristallo, Gabriele Cescutti, Ed Jenkins and Ryan Cooke are acknowledged. Gabriella Schiulaz is warmly thanked for checking the English. Funding by the European Union – NextGenerationEU RFF M4C2 1.1 PRIN 2022 project 2022RJLWHN URKA is also acknowledged.
References
- Abia, C., Tabernero, H. M., Korotin, S. A., et al. 2020, A&A, 642, A227 [NASA ADS] [CrossRef] [EDP Sciences] [Google Scholar]
- Arlandini, C., Käppeler, F., Wisshak, K., et al. 1999, ApJ, 525, 886 [Google Scholar]
- Asplund, M., Lambert, D. L., Nissen, P. E., Primas, F., & Smith, V. V. 2006, ApJ, 644, 229 [NASA ADS] [CrossRef] [Google Scholar]
- Banerjee, P., Heger, A., & Qian, Y.-Z. 2019, ApJ, 887, 187 [Google Scholar]
- Borisov, S., Charbonnel, C., Prantzos, N., Dumont, T., & Palacios, A. 2024, A&A, submitted [arXiv:2403.15534] [Google Scholar]
- Caffau, E., Bonifacio, P., Korotin, S. A., et al. 2021, A&A, 651, A20 [NASA ADS] [CrossRef] [EDP Sciences] [Google Scholar]
- Carswell, R. F., Jorgenson, R. A., Wolfe, A. M., & Murphy, M. T. 2011, MNRAS, 411, 2319 [NASA ADS] [CrossRef] [Google Scholar]
- Cartledge, S. I. B., Clayton, G. C., Gordon, K. D., et al. 2005, ApJ, 630, 355 [NASA ADS] [CrossRef] [Google Scholar]
- Cayrel, R., Steffen, M., Chand, H., et al. 2007, A&A, 473, L37 [NASA ADS] [CrossRef] [EDP Sciences] [Google Scholar]
- Choplin, A., Hirschi, R., Meynet, G., et al. 2018, A&A, 618, A133 [NASA ADS] [CrossRef] [EDP Sciences] [Google Scholar]
- Consiglio, R., de Salas, P. F., Mangano, G., et al. 2018, Comput. Phys. Commun., 233, 237 [NASA ADS] [CrossRef] [Google Scholar]
- Cox, N. L. J., Cordiner, M. A., Ehrenfreund, P., et al. 2007, A&A, 470, 941 [NASA ADS] [CrossRef] [EDP Sciences] [Google Scholar]
- Cupani, G., D’Odorico, V., Cristiani, S., et al. 2020, SPIE Conf. Ser., 11452, 114521U [Google Scholar]
- Cupani, G., Calderone, G., Cristiani, S., & Guarneri, F. 2024, ASP Conf. Ser., 535, 127 [NASA ADS] [Google Scholar]
- De Cia, A., Roman-Duval, J., Konstantopoulou, C., et al. 2024, A&A, 683, A216 [NASA ADS] [CrossRef] [EDP Sciences] [Google Scholar]
- D’Orazi, V., Lugaro, M., Campbell, S. W., et al. 2013, ApJ, 776, 59 [CrossRef] [Google Scholar]
- Duffau, S., Caffau, E., Sbordone, L., et al. 2017, A&A, 604, A128 [NASA ADS] [CrossRef] [EDP Sciences] [Google Scholar]
- Evans, C. J., Crowther, P. A., Fullerton, A. W., & Hillier, D. J. 2004, ApJ, 610, 1021 [NASA ADS] [CrossRef] [Google Scholar]
- Federman, S. R., Sneden, C., Schempp, W. V., & Smith, W. H. 1985, ApJ, 290, L55 [CrossRef] [Google Scholar]
- Federman, S. R., Knauth, D. C., & Lambert, D. L. 2004, ApJ, 603, L105 [NASA ADS] [CrossRef] [Google Scholar]
- Fields, B. D., & Olive, K. A. 2022, JCAP, 2022, 078 [CrossRef] [Google Scholar]
- García-Hernández, D. A., García-Lario, P., Plez, B., et al. 2006, Science, 314, 1751 [Google Scholar]
- García-Hernández, D. A., Manchado, A., Lambert, D. L., et al. 2009, ApJ, 705, L31 [CrossRef] [Google Scholar]
- Gratton, R. G., & Sneden, C. 1994, A&A, 287, 927 [NASA ADS] [Google Scholar]
- Gredel, R., Black, J. H., & Yan, M. 2001, A&A, 375, 553 [NASA ADS] [CrossRef] [EDP Sciences] [Google Scholar]
- Howk, J. C., Lehner, N., Fields, B. D., & Mathews, G. J. 2012, Nature, 489, 121 [Google Scholar]
- Izzo, L., Molaro, P., Cescutti, G., et al. 2022, MNRAS, 510, 5302 [CrossRef] [Google Scholar]
- Jenkins, E. B., & Wallerstein, G. 2017, ApJ, 838, 85 [NASA ADS] [CrossRef] [Google Scholar]
- Käppeler, F., Gallino, R., Bisterzo, S., & Aoki, W. 2011, Rev. Mod. Phys., 83, 157 [Google Scholar]
- Kawanomoto, S., Aoki, W., Kajino, T., & Mathews, G. J. 2009a, ApJ, 698, 509 [CrossRef] [Google Scholar]
- Kawanomoto, S., Kajino, T., Aoki, W., et al. 2009b, ApJ, 701, 1506 [CrossRef] [Google Scholar]
- Kisielius, R., Kulkarni, V. P., Ferland, G. J., et al. 2015, ApJ, 804, 76 [NASA ADS] [CrossRef] [Google Scholar]
- Knauth, D. C., Federman, S. R., & Lambert, D. L. 2003, ApJ, 586, 268 [NASA ADS] [CrossRef] [Google Scholar]
- Kobayashi, C., Karakas, A. I., & Umeda, H. 2011, MNRAS, 414, 3231 [Google Scholar]
- Lambert, D. L., Smith, V. V., Busso, M., Gallino, R., & Straniero, O. 1995, ApJ, 450, 302 [Google Scholar]
- Levshakov, S. A., Centurión, M., Molaro, P., & Kostina, M. V. 2006, A&A, 447, L21 [NASA ADS] [CrossRef] [EDP Sciences] [Google Scholar]
- Limongi, M., & Chieffi, A. 2018, ApJS, 237, 13 [NASA ADS] [CrossRef] [Google Scholar]
- Lind, K., Melendez, J., Asplund, M., Collet, R., & Magic, Z. 2013, A&A, 554, A96 [NASA ADS] [CrossRef] [EDP Sciences] [Google Scholar]
- Lodders, K. 2021, Space Sci. Rev., 217, 44 [NASA ADS] [CrossRef] [Google Scholar]
- Lucertini, F., Monaco, L., Caffau, E., Bonifacio, P., & Mucciarelli, A. 2022, A&A, 657, A29 [NASA ADS] [CrossRef] [EDP Sciences] [Google Scholar]
- Matas Pinto, A. M., Spite, M., Caffau, E., et al. 2021, A&A, 654, A170 [NASA ADS] [CrossRef] [EDP Sciences] [Google Scholar]
- Mathews, G. J., Kedia, A., Sasankan, N., et al. 2020, Mem. Soc. Astron. It., 91, 29 [NASA ADS] [Google Scholar]
- Mathewson, D. S., Ford, V. L., & Visvanathan, N. 1986, ApJ, 301, 664 [NASA ADS] [CrossRef] [Google Scholar]
- Molaro, P., & Monai, S. 1990, Mem. Soc. Astron. It., 61, 677 [NASA ADS] [Google Scholar]
- Molaro, P., Cescutti, G., & Fu, X. 2020, MNRAS, 496, 2902 [Google Scholar]
- Molaro, P., Aguado, D. S., Caffau, E., et al. 2023, A&A, 679, A72 [NASA ADS] [CrossRef] [EDP Sciences] [Google Scholar]
- Monaco, L., Bonifacio, P., Sbordone, L., Villanova, S., & Pancino, E. 2010, A&A, 519, L3 [NASA ADS] [CrossRef] [EDP Sciences] [Google Scholar]
- Morton, D. C. 1991, ApJS, 77, 119 [Google Scholar]
- Morton, D. C. 2000, ApJS, 130, 403 [Google Scholar]
- Morton, D. C. 2003, ApJS, 149, 205 [Google Scholar]
- Mucciarelli, A., Salaris, M., Bonifacio, P., Monaco, L., & Villanova, S. 2014, MNRAS, 444, 1812 [NASA ADS] [CrossRef] [Google Scholar]
- Mucciarelli, A., Minelli, A., Bellazzini, M., et al. 2023a, A&A, 671, A124 [NASA ADS] [CrossRef] [EDP Sciences] [Google Scholar]
- Mucciarelli, A., Minelli, A., Lardo, C., et al. 2023b, A&A, 677, A61 [NASA ADS] [CrossRef] [EDP Sciences] [Google Scholar]
- Muller, S., Guélin, M., Dumke, M., Lucas, R., & Combes, F. 2006, A&A, 458, 417 [NASA ADS] [CrossRef] [EDP Sciences] [Google Scholar]
- Pepe, F., Cristiani, S., Rebolo, R., et al. 2021, A&A, 645, A96 [NASA ADS] [CrossRef] [EDP Sciences] [Google Scholar]
- Pequignot, D., & Aldrovandi, S. M. V. 1986, A&A, 161, 169 [Google Scholar]
- Perdigon, J., de Laverny, P., Recio-Blanco, A., et al. 2021, A&A, 647, A162 [NASA ADS] [CrossRef] [EDP Sciences] [Google Scholar]
- Pitrou, C., Coc, A., Uzan, J.-P., & Vangioni, E. 2021, MNRAS, 502, 2474 [NASA ADS] [CrossRef] [Google Scholar]
- Pospelov, M., & Pradler, J. 2010, Ann. Rev. Nucl. Part. Sci., 60, 539 [NASA ADS] [CrossRef] [Google Scholar]
- Raiteri, C. M., Gallino, R., Busso, M., Neuberger, D., & Kaeppeler, F. 1993, ApJ, 419, 207 [CrossRef] [Google Scholar]
- Reggiani, H., Amarsi, A. M., Lind, K., et al. 2019, A&A, 627, A177 [EDP Sciences] [Google Scholar]
- Richard, O., Michaud, G., & Richer, J. 2002, ApJ, 580, 1100 [Google Scholar]
- Richard, O., Michaud, G., & Richer, J. 2005, ApJ, 619, 538 [Google Scholar]
- Ritchey, A. M., Welty, D. E., Dahlstrom, J. A., & York, D. G. 2015, ApJ, 799, 197 [NASA ADS] [CrossRef] [Google Scholar]
- Sansonetti, C. J., Richou, B., Engleman Rolf, J., & Radziemski, L. J., 1995, Phys. Rev. A, 52, 2682 [NASA ADS] [CrossRef] [Google Scholar]
- Sbordone, L., Bonifacio, P., Caffau, E., et al. 2010, A&A, 522, A26 [NASA ADS] [CrossRef] [EDP Sciences] [Google Scholar]
- Shejeelammal, J., & Goswami, A. 2020, J. Astrophys. Astron., 41, 37 [NASA ADS] [CrossRef] [Google Scholar]
- Sofia, U. J., Gordon, K. D., Clayton, G. C., et al. 2006, ApJ, 636, 753 [NASA ADS] [CrossRef] [Google Scholar]
- Spite, F., & Spite, M. 1982a, A&A, 115, 357 [NASA ADS] [Google Scholar]
- Spite, M., & Spite, F. 1982b, Nature, 297, 483 [NASA ADS] [CrossRef] [Google Scholar]
- Steigman, G. 1996, ApJ, 457, 737 [CrossRef] [Google Scholar]
- Steigman, G., & Walker, T. P. 1992, ApJ, 385, L13 [CrossRef] [Google Scholar]
- Takeda, Y. 2019, Stars and Galaxies, 2, 1 [NASA ADS] [Google Scholar]
- Takeda, Y. 2021, Astron. Nachr., 342, 515 [Google Scholar]
- Tchernyshyov, K., Meixner, M., Seale, J., et al. 2015, ApJ, 811, 78 [NASA ADS] [CrossRef] [Google Scholar]
- Tomkin, J., & Lambert, D. L. 1989, MNRAS, 241, 777 [NASA ADS] [CrossRef] [Google Scholar]
- van Raai, M. A., Lugaro, M., Karakas, A. I., García-Hernández, D. A., & Yong, D. 2012, A&A, 540, A44 [NASA ADS] [CrossRef] [EDP Sciences] [Google Scholar]
- Wang, E. X., Nordlander, T., Asplund, M., et al. 2022, MNRAS, 509, 1521 [Google Scholar]
- Welsh, L., Cooke, R., Fumagalli, M., & Pettini, M. 2020, MNRAS, 494, 1411 [NASA ADS] [CrossRef] [Google Scholar]
- Welty, D. E., & Hobbs, L. M. 2001, ApJS, 133, 345 [NASA ADS] [CrossRef] [Google Scholar]
- Welty, D. E., Hobbs, L. M., & Morton, D. C. 2003, ApJS, 147, 61 [NASA ADS] [CrossRef] [Google Scholar]
- Welty, D. E., Federman, S. R., Gredel, R., Thorburn, J. A., & Lambert, D. L. 2006, ApJS, 165, 138 [Google Scholar]
- Welty, D. E., Xue, R., & Wong, T. 2012, ApJ, 745, 173 [NASA ADS] [CrossRef] [Google Scholar]
- Welty, D. E., Howk, J. C., Lehner, N., & Black, J. H. 2013, MNRAS, 428, 1107 [NASA ADS] [CrossRef] [Google Scholar]
- Welty, D. E., Lauroesch, J. T., Wong, T., & York, D. G. 2016, ApJ, 821, 118 [CrossRef] [Google Scholar]
- White, R. E. 1986, ApJ, 307, 777 [Google Scholar]
- Yeh, T.-H., Olive, K. A., & Fields, B. D. 2021, JCAP, 2021, 046 [Google Scholar]
Appendix A: Table A.1
Column densities toward Sk 143.
All Tables
All Figures
|
Fig. 1. Absorption lines for a representative set of elements toward Sk 143 . The radial velocity correction reported in Table A.1 was applied to the transitions. The data for the lines falling in the optical range were taken from our ESPRESSO observations, and those in the ultraviolet were taken from HST-STIS, the Space Telescope Imaging Spectrograph, acquired under program 9383 (PI: K. Gordon) and reported in Sofia et al. (2006). The blue lines show the continuum, the green line shows the model that provides the best fit to the line absorption, and the red line shows the residuals. |
| In the text | |
|
Fig. 2. Spectrum of Sk143 around the Rb I 780.0 nm line. The positions of the hyperfine splitting of 85Rb (orange) and 87Rb (light blue) are indicated, and the green line shows the model. |
| In the text | |
|
Fig. 3. Spectrum of Sk143 around the Li I resonance doublet at 670.7 nm. The isotope of 7Li I is plotted in light blue and 6Li in orange. |
| In the text | |
Current usage metrics show cumulative count of Article Views (full-text article views including HTML views, PDF and ePub downloads, according to the available data) and Abstracts Views on Vision4Press platform.
Data correspond to usage on the plateform after 2015. The current usage metrics is available 48-96 hours after online publication and is updated daily on week days.
Initial download of the metrics may take a while.