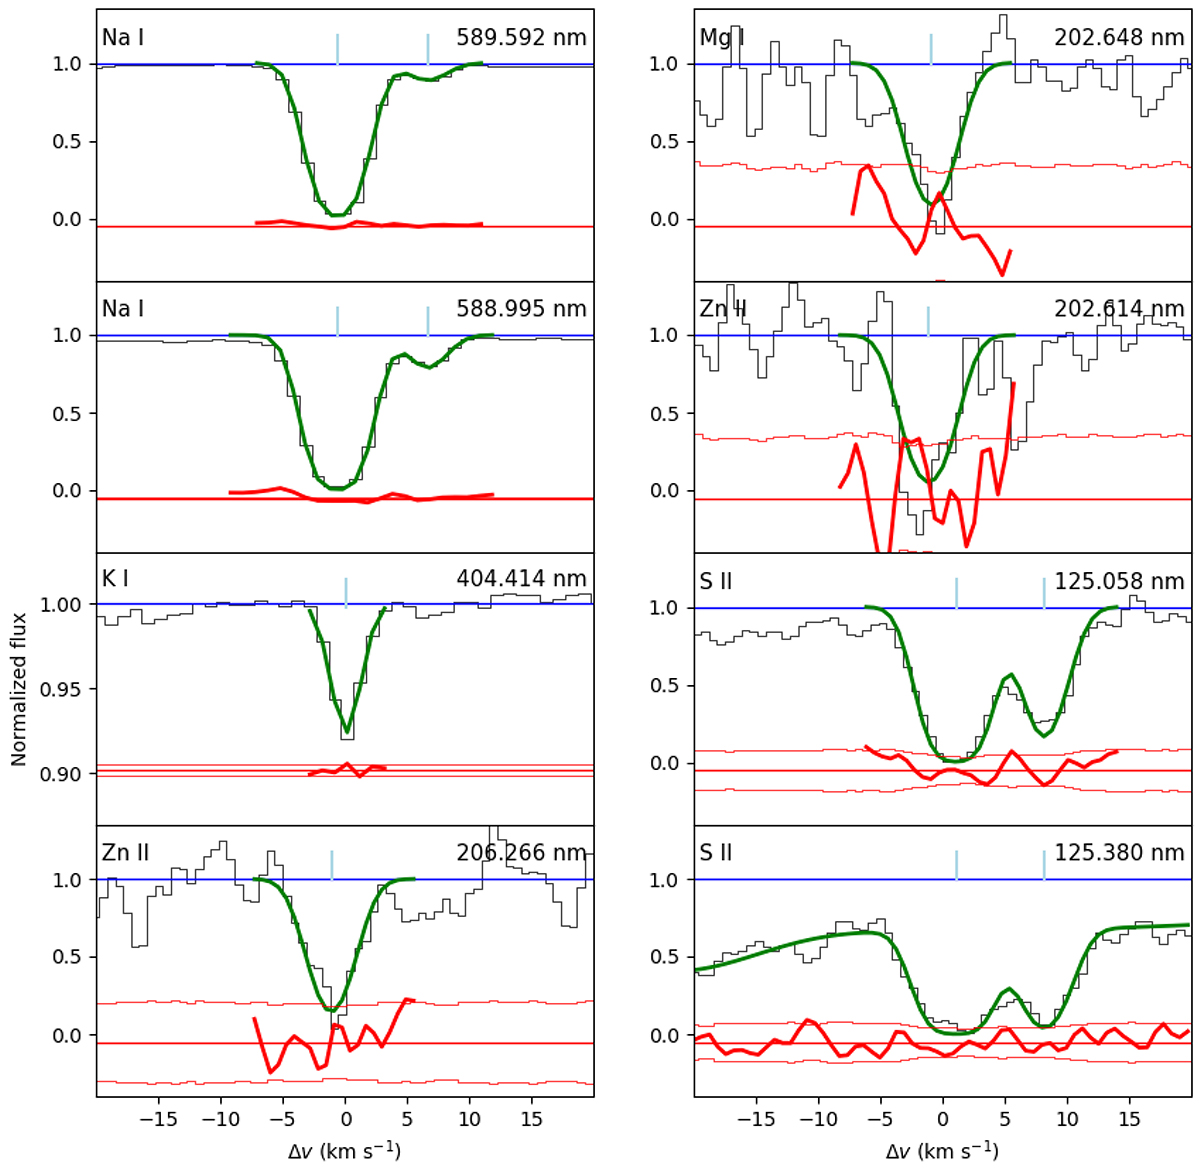
Fig. 1.
Download original image
Absorption lines for a representative set of elements toward Sk 143 . The radial velocity correction reported in Table A.1 was applied to the transitions. The data for the lines falling in the optical range were taken from our ESPRESSO observations, and those in the ultraviolet were taken from HST-STIS, the Space Telescope Imaging Spectrograph, acquired under program 9383 (PI: K. Gordon) and reported in Sofia et al. (2006). The blue lines show the continuum, the green line shows the model that provides the best fit to the line absorption, and the red line shows the residuals.
Current usage metrics show cumulative count of Article Views (full-text article views including HTML views, PDF and ePub downloads, according to the available data) and Abstracts Views on Vision4Press platform.
Data correspond to usage on the plateform after 2015. The current usage metrics is available 48-96 hours after online publication and is updated daily on week days.
Initial download of the metrics may take a while.