Open Access
Fig. 5.
Download original image
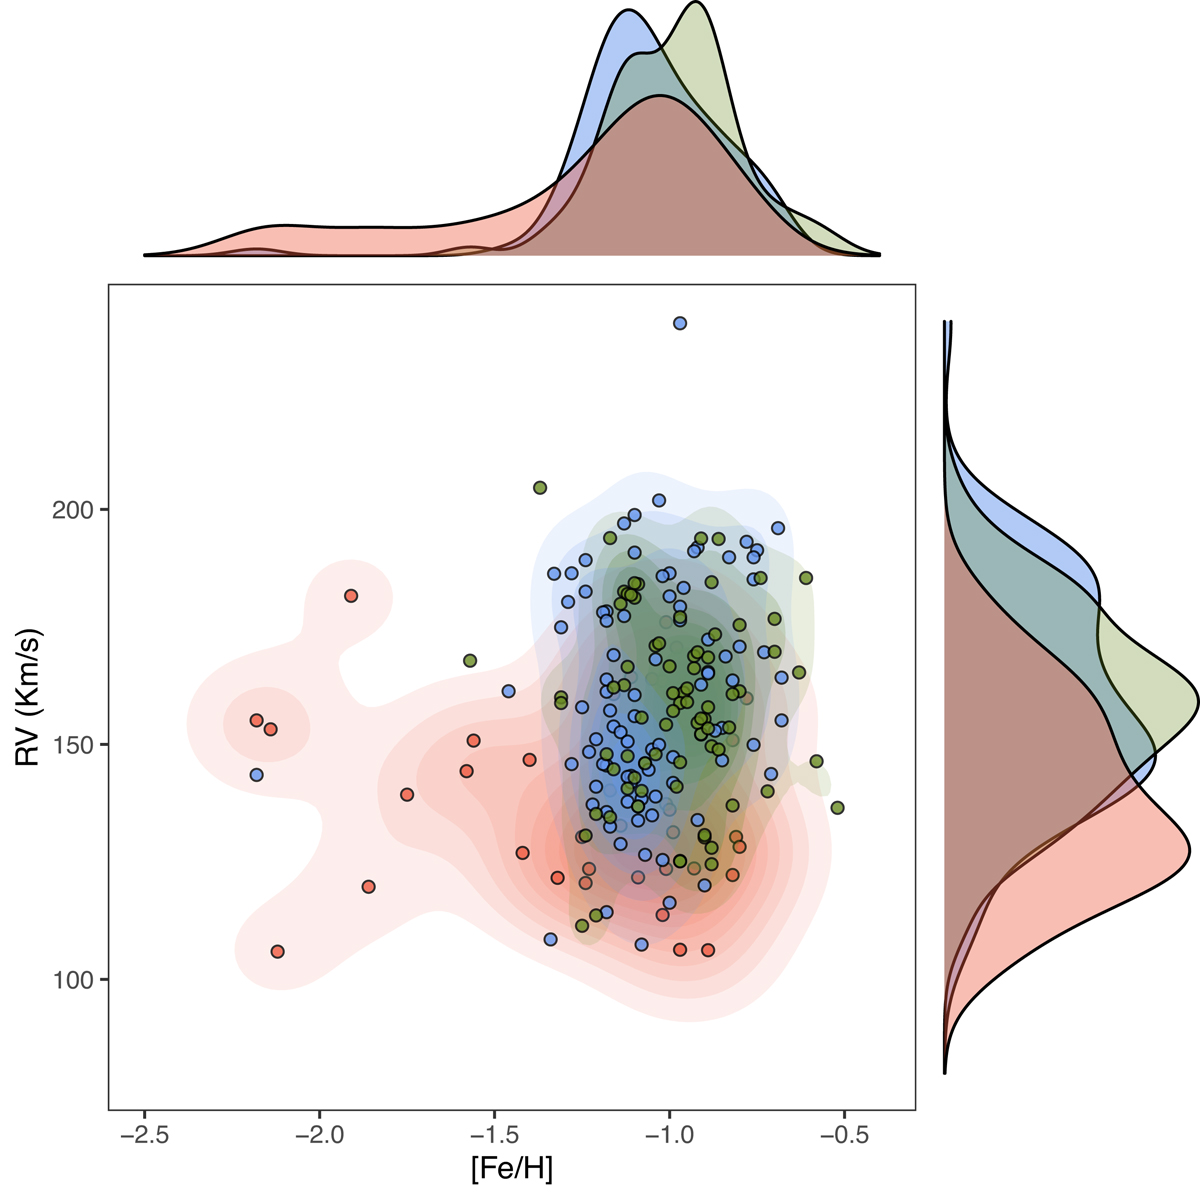
RVs plotted against [Fe/H] for target stars in the central panel of the figure. Colour-shaded areas denote the contours of the three clusters RV vs. [Fe/H] distributions. Side plots show the kernel distributions of the RV (right panel) and the [Fe/H] values (top panel) for each cluster. Same colours as in Fig. 4.
Current usage metrics show cumulative count of Article Views (full-text article views including HTML views, PDF and ePub downloads, according to the available data) and Abstracts Views on Vision4Press platform.
Data correspond to usage on the plateform after 2015. The current usage metrics is available 48-96 hours after online publication and is updated daily on week days.
Initial download of the metrics may take a while.