Fig. 2
Download original image
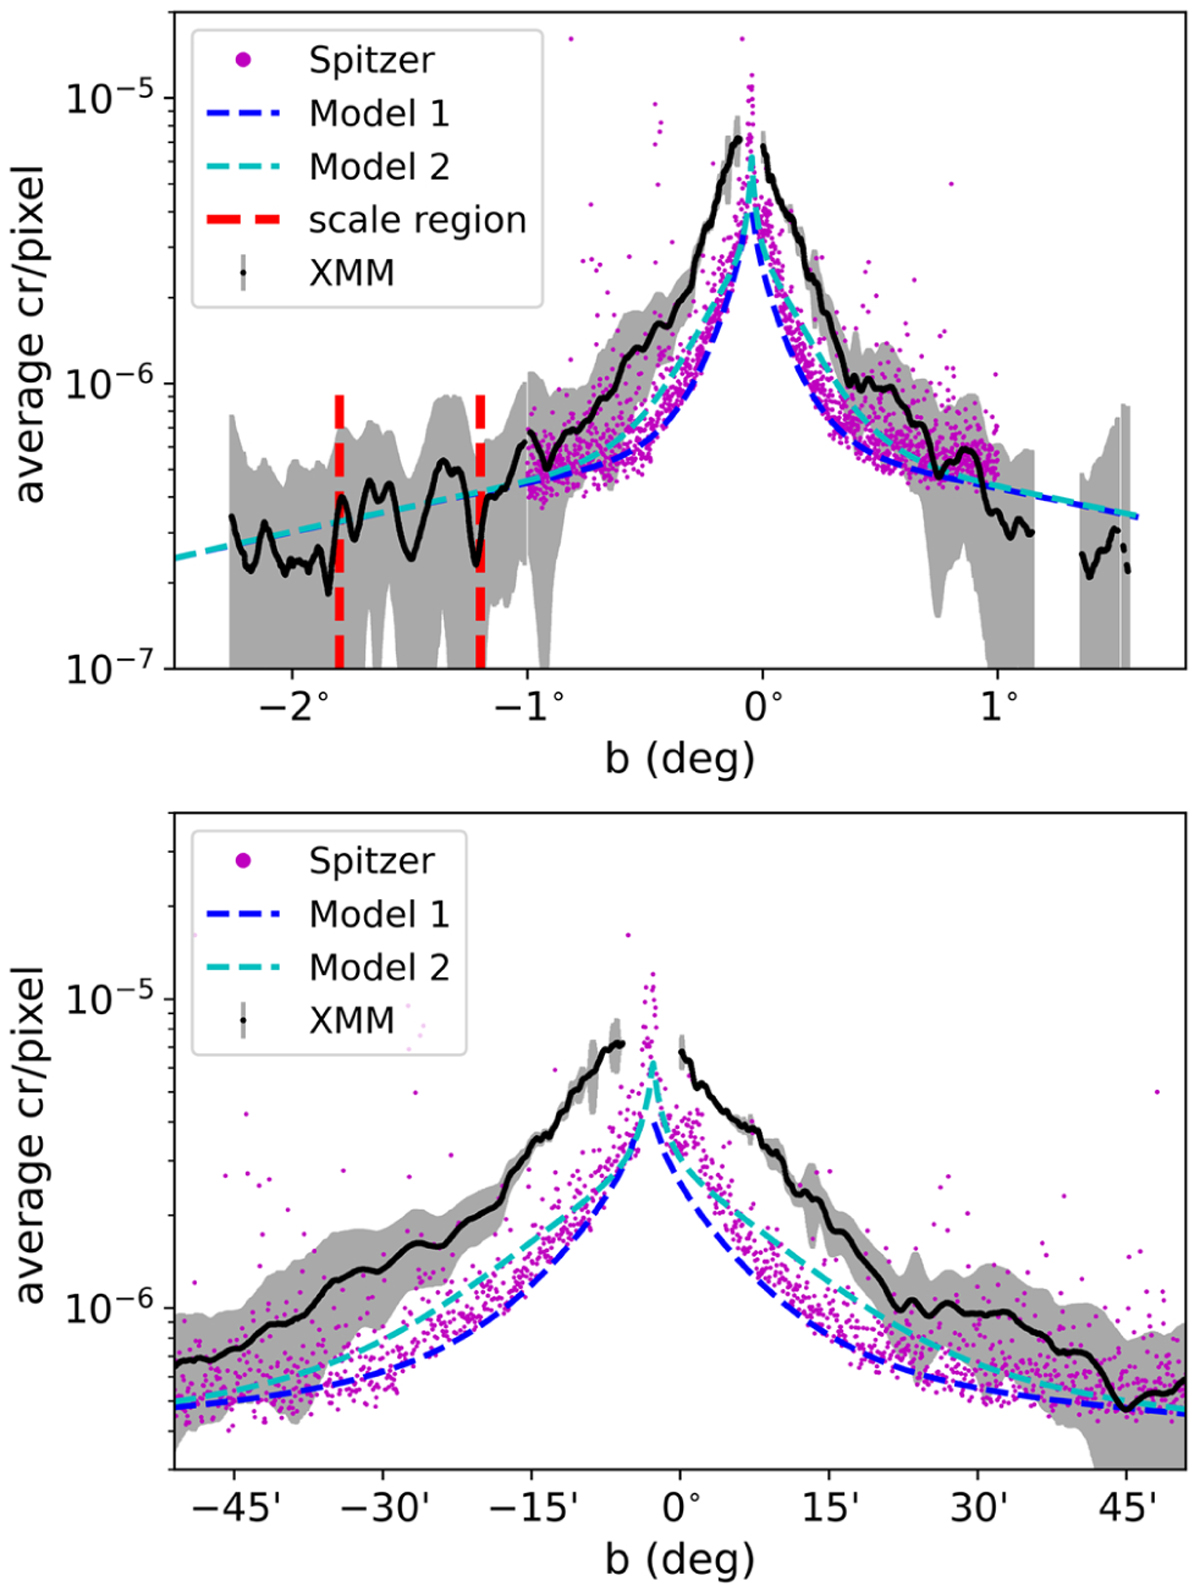
Latitudinal profiles of the X-ray, SMD models, and infrared data. Top panel: average count rate per pixel for the Fe XXV Band over Galactic latitude (b), extracted from a profile of 0.5 deg width centred at Sgr A*. The XMM-Newton and Spitzer data are shown with the black line and the magenta dots respectively. The profiles extracted from the SMD Model 1 and Model 2 are shown with blue and cyan dashed lines respectively. The region enclosed within the red dashed lines is used to scale the XMM-Newton and SMD profiles. Bottom panel: same as top but for b between ±0.85°.
Current usage metrics show cumulative count of Article Views (full-text article views including HTML views, PDF and ePub downloads, according to the available data) and Abstracts Views on Vision4Press platform.
Data correspond to usage on the plateform after 2015. The current usage metrics is available 48-96 hours after online publication and is updated daily on week days.
Initial download of the metrics may take a while.