Fig. A.1
Download original image
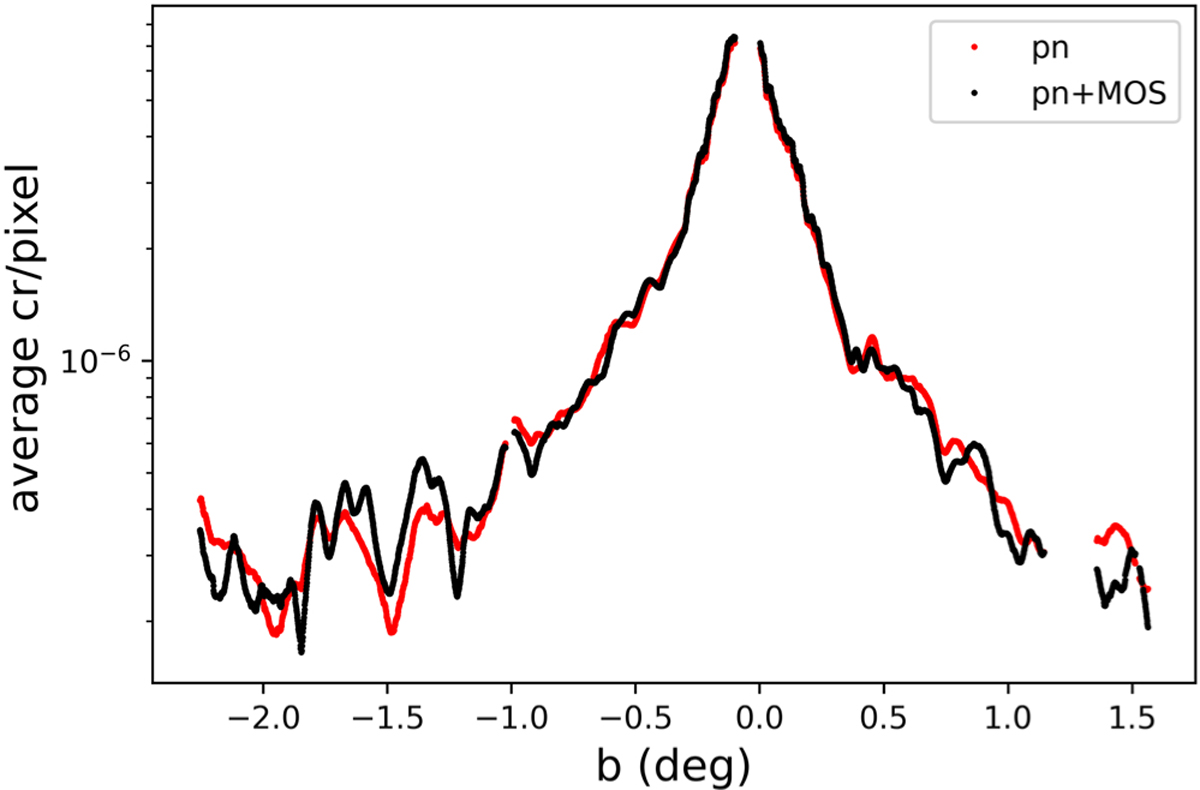
Comparison between XMM-Newton EPIC-pn and pn+MOS latitudinal profiles. Average count rate per pixel over Galactic latitude (b), extracted from a profile of 0.5 deg width centred at Sgr A*. With red dots we show the profile extracted from the EPIC-pn mosaic, while with black dots we show the profile extracted from the pn+MOS mosaic, after scaling the MOS exposure maps to account for the effective area differences between MOS and pn at the 6.62-6.8 keV band.
Current usage metrics show cumulative count of Article Views (full-text article views including HTML views, PDF and ePub downloads, according to the available data) and Abstracts Views on Vision4Press platform.
Data correspond to usage on the plateform after 2015. The current usage metrics is available 48-96 hours after online publication and is updated daily on week days.
Initial download of the metrics may take a while.