Fig. 10
Download original image
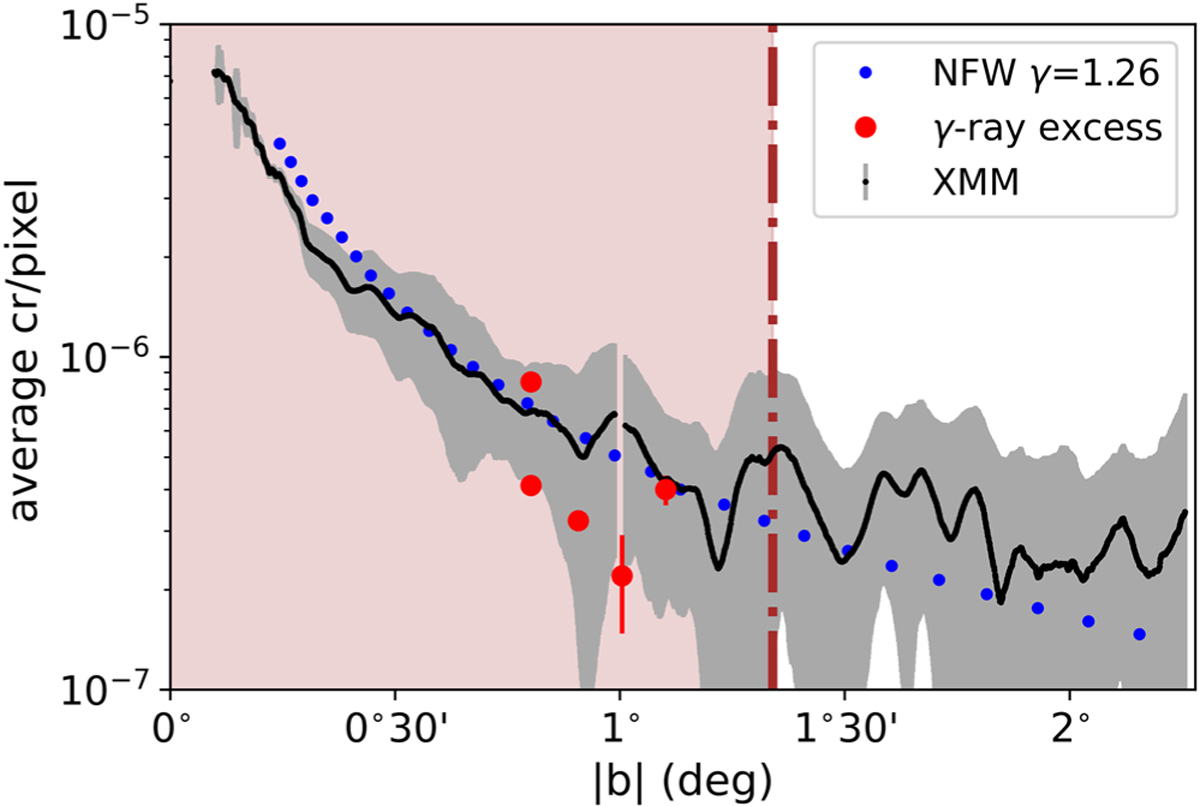
Comparison of the X-ray and the γ-ray excesses in the GC. XMM-Newton Fe XXV profile (black line) adopted from Fig. 2 for negative latitudes. With red points we show the GC excess intensity at 2 GeV as measured by various studies (Hooper & Goodenough 2011; Boyarsky et al. 2011; Gordon & Macías 2013; Abazajian et al. 2014; Daylan et al. 2016). The blue dotted line represents the emission from dark matter annihilation for a Navarro–Frenk-White distribution (NFW; Navarro et al. 1997), which best represents the γ-ray excess data. Both red points and blue points associated with the γ-ray excess are normalised along the y-axis to match the X-ray profile for illustration purposes. For more details see Murgia (2020) and their Fig. 2.
Current usage metrics show cumulative count of Article Views (full-text article views including HTML views, PDF and ePub downloads, according to the available data) and Abstracts Views on Vision4Press platform.
Data correspond to usage on the plateform after 2015. The current usage metrics is available 48-96 hours after online publication and is updated daily on week days.
Initial download of the metrics may take a while.