| Issue |
A&A
Volume 671, March 2023
|
|
|---|---|---|
| Article Number | C7 | |
| Number of page(s) | 2 | |
| Section | Interstellar and circumstellar matter | |
| DOI | https://doi.org/10.1051/0004-6361/202243391e | |
| Published online | 13 March 2023 | |
Diffuse non-thermal emission in the disks of the Magellanic Clouds (Corrigendum)
1
INAF-Trieste Astronomical Observatory,
via G.B.Tiepolo 11,
34100
Trieste,
Italy ;
INFN-Trieste,
via A. valerio 2,
34127
Trieste,
Italy
e-mail: massimo.persic@inaf.it
2
School of Physics & Astronomy, Tel Aviv University,
Tel Aviv
69978,
Israel ;
Center for Astrophysics and Space Sciences, University of California at San Diego,
La Jolla,
CA 92093,
USA
e-mail: yoelr@wise.tau.ac.il
Key words: radiation mechanisms: non-thermal / Magellanic Clouds / gamma rays: galaxies / radio continuum: galaxies / astroparticle physics / errata, addenda
A typographical error occurred in the implementation of the Coulomb energy-loss term (Eq. (4) of Rephaeli & Persic 2015), which was used to calculate the steady-state spectra of secondary electrons (CRe) in the original paper. This caused an underestimation of the Coulomb loss rate and resulted in the secondary CRe spectrum to be overestimated and steeper. The revised spectral parameters are specified in Table 1, which replaces Table 3 of the original paper. At low energies the revised indices, q1, are essentially unchanged but the breaks, γb1, are ~2–3 times higher, so the effective slopes are flatter.
The error is largely inconsequential to the non-thermal (NT) spectral energy distribution (SED) models of the Magellanic Cloud galaxies presented in the original paper. The reason is that the frequencies of the modeled radio data are, for both galaxies, well above the frequency range of the synchrotron radiation emitted by the Coulomb-affected portions of the respective secondary-CRe spectra. Furthermore, secondary synchrotron is subdominant in both SED models. Correspondingly, the updated SED models in Figs. 1 (radio) and 2 (broadband) hardly differ from their counterparts in the original paper (see Figs. 3 (right) and 5 (right) and Figs. 4 and 6 (top) in the original paper, respectively). For simplicity, in this Erratum we plot revised models only for the reference T+17 dataset, which uses the G1 γ-ray data of Tang et al. (2017). Similar considerations, however, hold for the auxiliary A+16 dataset, which uses the E0 γ-ray data of Ackermann et al. (2016).
References
- Ackermann, M., Albert, A., Atwood, W. B., et al. 2016, A&A, 586, A71 (A+16) [NASA ADS] [CrossRef] [EDP Sciences] [Google Scholar]
- Rephaeli, Y., & Persic, M. 2015, ApJ, 805, 111 [NASA ADS] [CrossRef] [Google Scholar]
- Tang, Q. W., Peng, F. K., Liu, R. Y., Tam, P. H. T., & Wang, X. Y. 2017, ApJ, 843, 42 (T+17) [NASA ADS] [CrossRef] [Google Scholar]
© The Authors 2023
 Open Access article, published by EDP Sciences, under the terms of the Creative Commons Attribution License (https://creativecommons.org/licenses/by/4.0), which permits unrestricted use, distribution, and reproduction in any medium, provided the original work is properly cited.
This article is published in open access under the Subscribe to Open model. Subscribe to A&A to support open access publication.
All Tables
All Figures
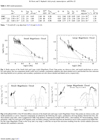 |
Fig. 1 Radio spectra of the Small (left) and Large (right) Magellanic Cloud. Data points are shown as dots, and model predictions as curves. For each galaxy the two-component model (solid curve) includes synchrotron radiation (dot-short-dashed curve) and thermal free-free emission (dot-long-dashed curve); primary and secondary synchrotron are also shown (dashed and dotted curves, respectively). |
| In the text | |
 |
Fig. 2 Broadband SEDs of the NT disk-diffuse emission of the Small (left) and Large (right) Magellanic Cloud. Data points are shown as dots, and model predictions as curves. Emission components are plotted by the following line types: synchrotron, dot-long-dashed; thermal free-free, dot-short-dashed; total radio, solid; Comptonized CMB, long-dashed; Comptonized starlight (EBL+FGL), short-dashed; NT bremsstrahlung, dotted; and pionic, solid. For each type of NT leptonic yield, secondary, primary, and total emissions are denoted as curves with a progressively higher flux. For the Large Magellanic Cloud, in the X-ray and γ-ray range, a solid line on top of the emissions resulting from the various radiative processes indicates the cumulative emission. |
| In the text | |
Current usage metrics show cumulative count of Article Views (full-text article views including HTML views, PDF and ePub downloads, according to the available data) and Abstracts Views on Vision4Press platform.
Data correspond to usage on the plateform after 2015. The current usage metrics is available 48-96 hours after online publication and is updated daily on week days.
Initial download of the metrics may take a while.