Fig. 8
Download original image
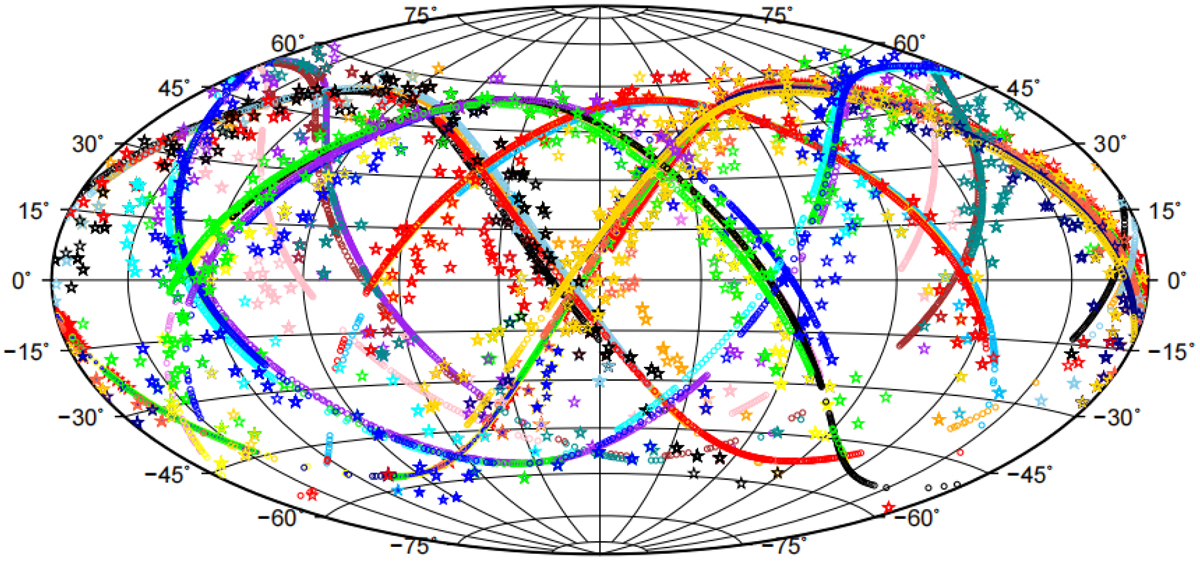
Tracks of all available GPS satellites (denoted as dots, with each color representing one satellite) and positions of radio source calibrators (denoted as stars; the calibrators have the same color as their closest satellites) in the ICRF. The horizontal axis shows the right ascension and the vertical axis shows the declination in the ICRF.
Current usage metrics show cumulative count of Article Views (full-text article views including HTML views, PDF and ePub downloads, according to the available data) and Abstracts Views on Vision4Press platform.
Data correspond to usage on the plateform after 2015. The current usage metrics is available 48-96 hours after online publication and is updated daily on week days.
Initial download of the metrics may take a while.