Fig. 1.
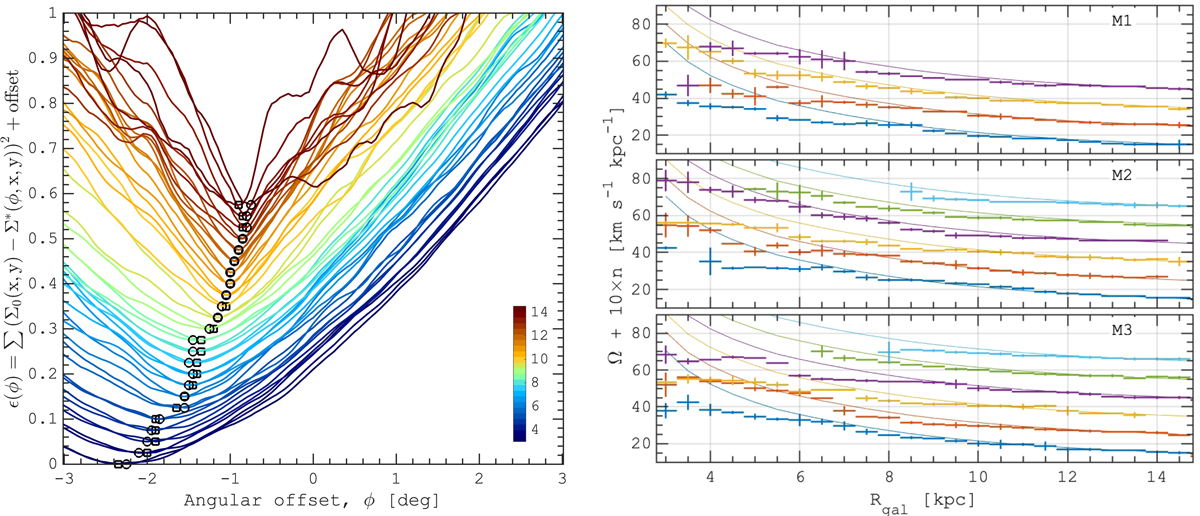
Download original image
Example of the pattern speed measurement for a single spiral arm in model M1. Left: coloured lines correspond to the sum of the squared-root differences between the stellar density at t0 = 0.6 Gyr and the ones from t0 ± 1 Myr rotated by a certain angle ϕ (see Eq. (1)). The minimum value corresponds to the angle of rotation which being divided by 1 Myr results in the pattern speed value (black symbols) at a given Rgal. Right: pattern speed of the spiral arms in different models. Values for the individual spiral arms are shown by the error bars of different colours. For a better representation, the pattern speed for each arm is shifted vertically by 10 km s−1 kpc−1 and compared to the circular frequency (solid lines) which is also shifted by the same values.
Current usage metrics show cumulative count of Article Views (full-text article views including HTML views, PDF and ePub downloads, according to the available data) and Abstracts Views on Vision4Press platform.
Data correspond to usage on the plateform after 2015. The current usage metrics is available 48-96 hours after online publication and is updated daily on week days.
Initial download of the metrics may take a while.