Fig. 1
Download original image
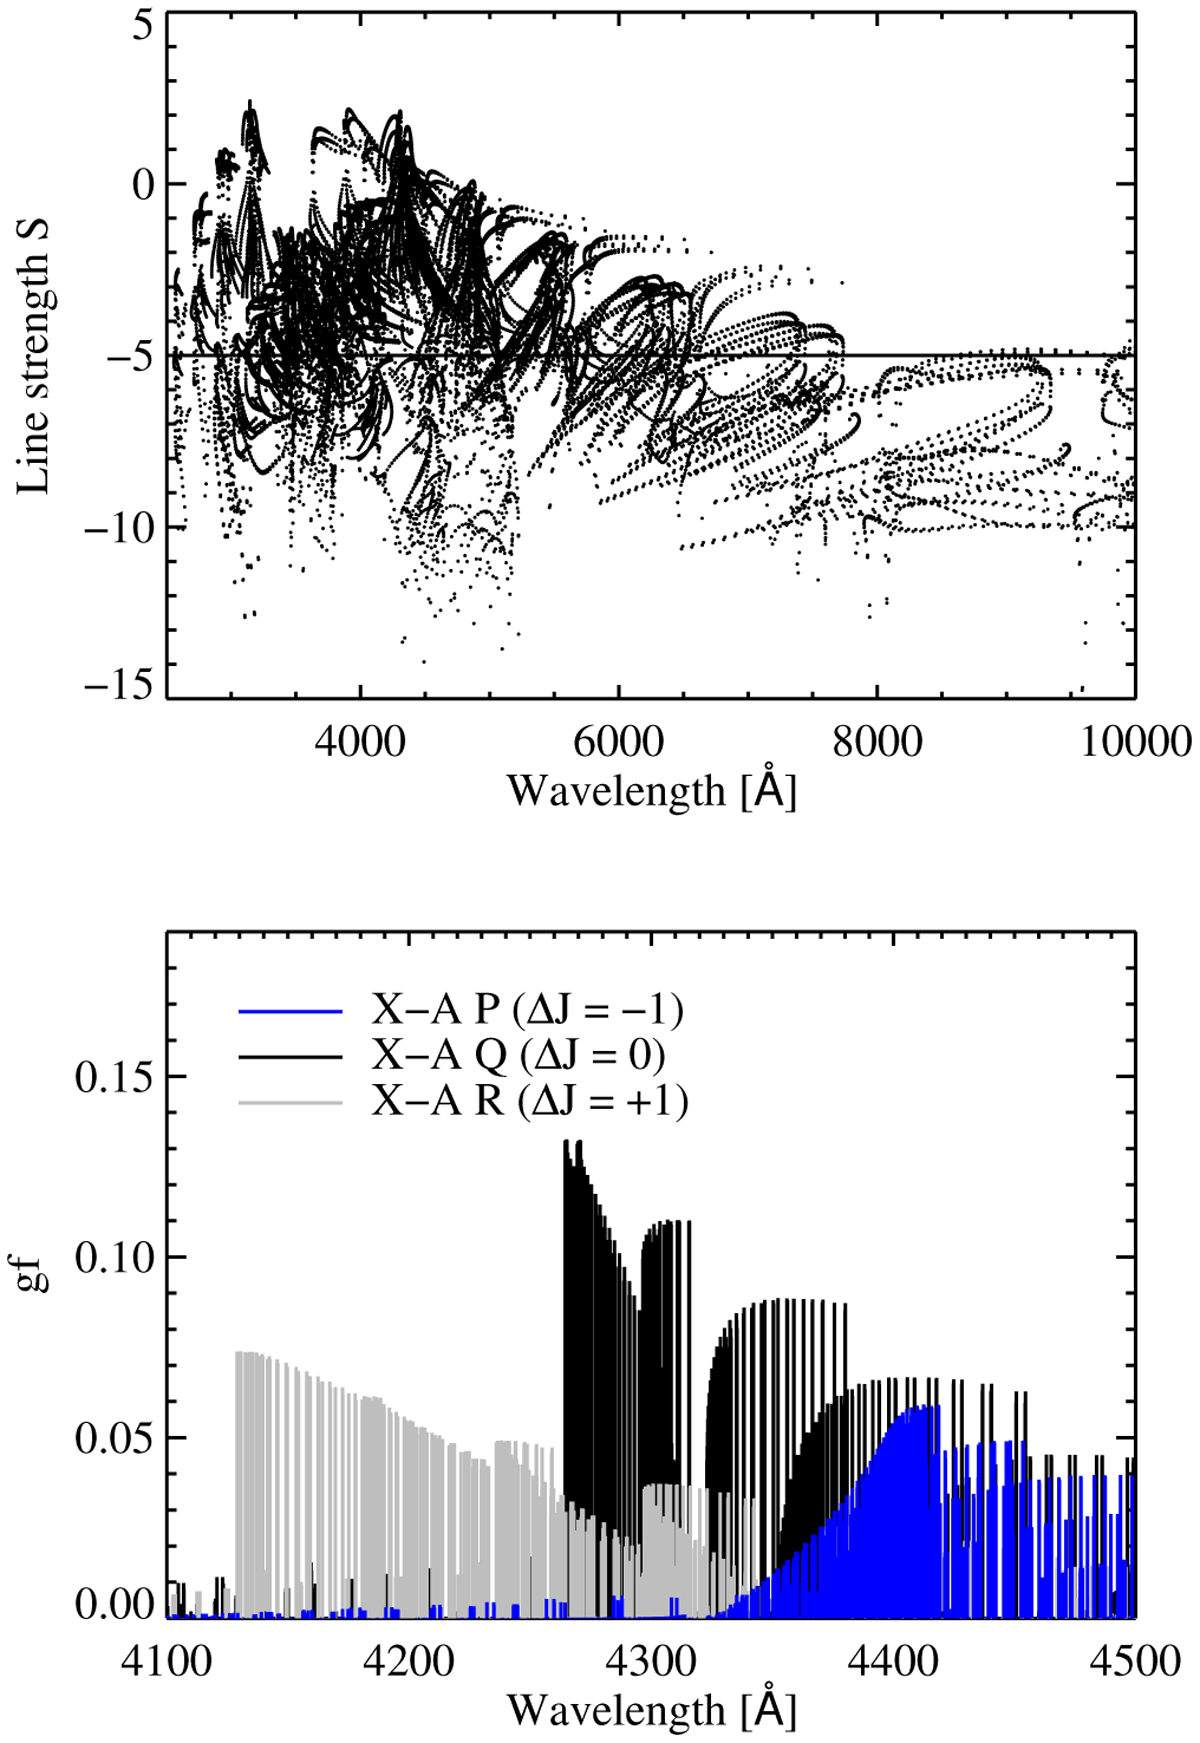
Properties of the transitions in the CH molecule model. Top panel: distribution of line strengths in the entire CH system. Only transitions with strengths greater than S = –5 were included in the NLTE model molecule. Bottom panel: X–A spectrum of the CH molecule around the wavelength of ~4300 Å. The P, Q, and R branches are indicated. The strongest feature in this range, corresponding to J′ − J″ = 0 (vibrational transition accompanied by a rotational transition) is the astrophysically famous 'G band'.
Current usage metrics show cumulative count of Article Views (full-text article views including HTML views, PDF and ePub downloads, according to the available data) and Abstracts Views on Vision4Press platform.
Data correspond to usage on the plateform after 2015. The current usage metrics is available 48-96 hours after online publication and is updated daily on week days.
Initial download of the metrics may take a while.