Fig. 1.
Download original image
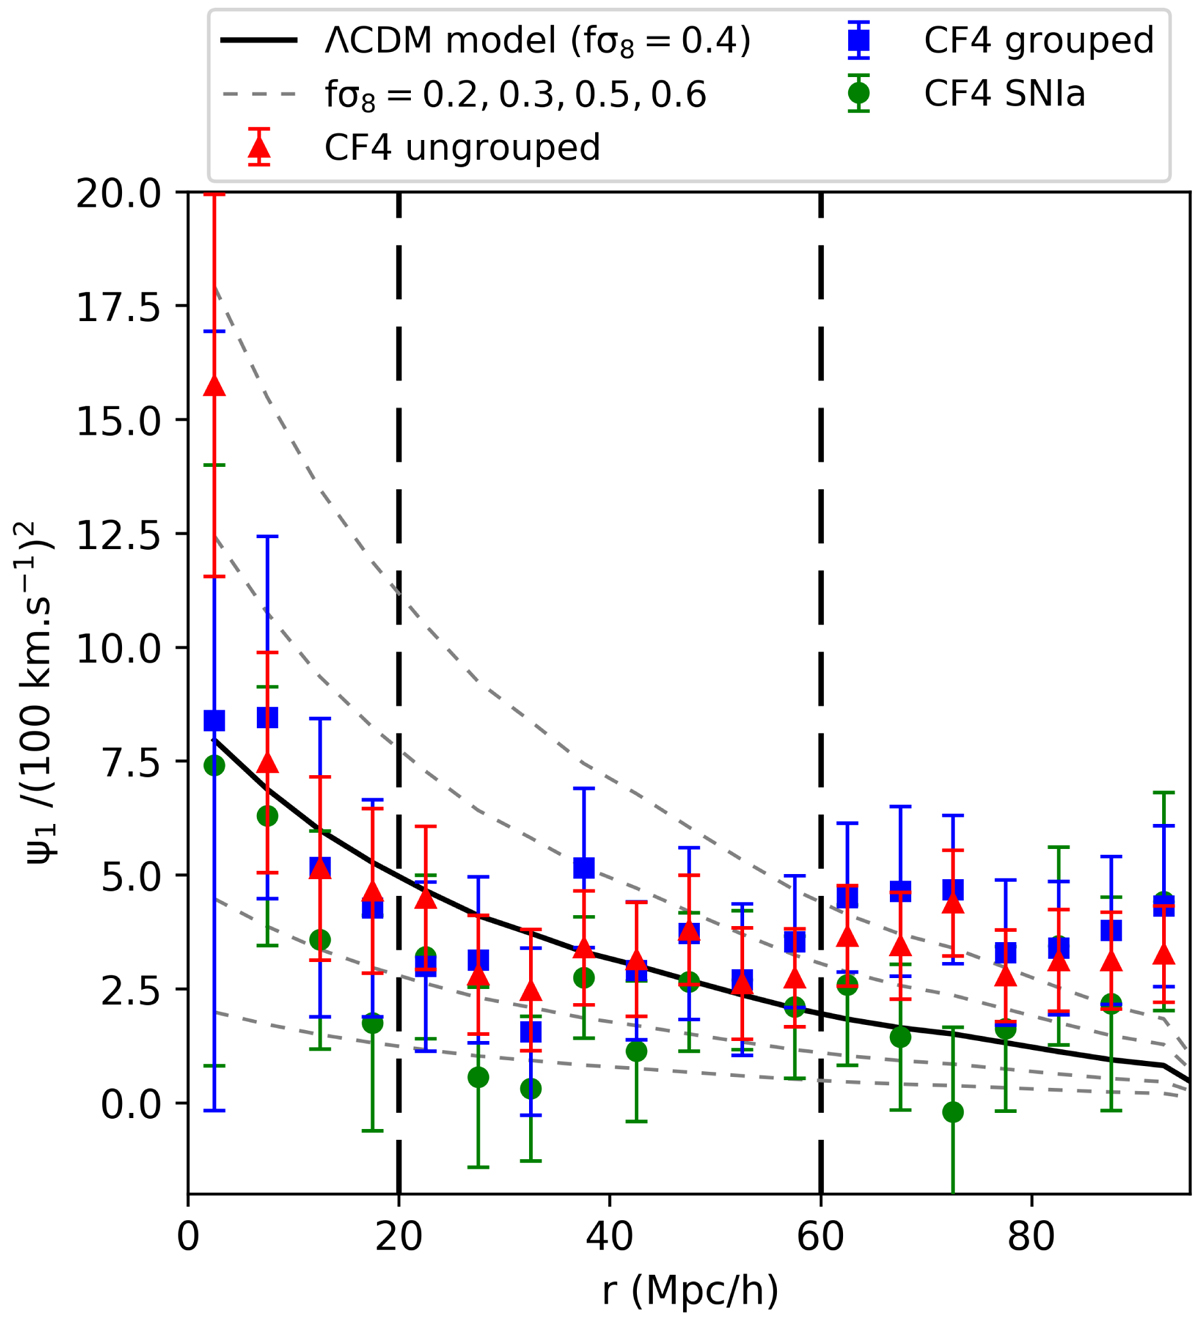
Estimator to compute the growth rate of structures using 1008 supernovae (in green), 36 000 galaxy groups (in blue), and 56 000 individual galaxy distances (in red). Computation was carried out as in Dupuy et al. (2019). The distance r is the pairwise separation bin in ![]() Mpc between radial peculiar velocities in the datasets. Error bars represent the observational errors of the distance moduli (no cosmic variance is considered in this plot). The number density of data per bin of pairwise separation is of crucial importance in order to assess the result. The current supernovae sample is too sparse for separations smaller than 20–30
Mpc between radial peculiar velocities in the datasets. Error bars represent the observational errors of the distance moduli (no cosmic variance is considered in this plot). The number density of data per bin of pairwise separation is of crucial importance in order to assess the result. The current supernovae sample is too sparse for separations smaller than 20–30 ![]() Mpc.
Mpc.
Current usage metrics show cumulative count of Article Views (full-text article views including HTML views, PDF and ePub downloads, according to the available data) and Abstracts Views on Vision4Press platform.
Data correspond to usage on the plateform after 2015. The current usage metrics is available 48-96 hours after online publication and is updated daily on week days.
Initial download of the metrics may take a while.