| Issue |
A&A
Volume 670, February 2023
|
|
|---|---|---|
| Article Number | L8 | |
| Number of page(s) | 11 | |
| Section | Letters to the Editor | |
| DOI | https://doi.org/10.1051/0004-6361/202245254 | |
| Published online | 31 January 2023 | |
Letter to the Editor
Reflections on nebulae around young stars
A systematic search for late-stage infall of material onto Class II disks
1
European Southern Observatory, Karl-Schwarzschild-Str. 2, 85748 Garching bei München, Germany
e-mail: This email address is being protected from spambots. You need JavaScript enabled to view it.
2
University Observatory, Faculty of Physics, Ludwig-Maximilians-Universität München, Scheinerstr. 1, 81679 Munich, Germany
3
Exzellenzcluster ORIGINS, Boltzmannstr. 2, 85748 Garching, Germany
4
Università degli Studi di Milano, Via Giovanni Celoria 16, 20133 Milano, Italy
5
Leiden Observatory, Leiden University, Niels Bohrweg 2, 2333 CA Leiden, The Netherlands
6
Anton Pannekoek Institute for Astronomy (API), University of Amsterdam, Science Park 904, 1098 XH Amsterdam, The Netherlands
7
Department of Astrophysics, University of Vienna, Türkenschanzstrasse 17, 1180 Vienna, Austria
8
Department of Astronomy, University of Virginia, Charlottesville, VA 22904, USA
9
Max-Planck Institute for Extraterrestrial Physics, Gießenbachstraße 1, 85748 Garching, Germany
10
Institute for Astronomy, University of Hawaii, Honolulu, HI 96822, USA
11
Academia Sinica Institute of Astronomy and Astrophysics, 11F of Astro-Math Bldg, 1, Sec. 4, Roosevelt Rd, Taipei 10617, Taiwan
12
Alma Mater Studiorum Università di Bologna, Dipartimento di Fisica e Astronomia (DIFA), Via Gobetti 93/2, 40129 Bologna, Italy
Received:
19
October
2022
Accepted:
2
January
2023
Abstract
Context. While it is generally assumed that Class II sources evolve largely in isolation from their environment, many still lie close to molecular clouds and may continue to interact with them. This may result in late accretion of material onto the disk that can significantly influence disk processes and planet formation.
Aims. In order to systematically study late infall of gas onto disks, we identify candidate Class II sources in close vicinity to a reflection nebula (RN) that may be undergoing this process.
Methods. First we targeted Class II sources with known kilo-au scale gas structures – possibly due to late infall of material – and we searched for RNe in their vicinity in optical and near-infrared images. Second, we compiled a catalogue of Class II sources associated with RNe and looked for the large-scale CO structures in archival ALMA data. Using the catalogues of protostars and RNe, we also estimated the probability of Class II sources interacting with surrounding material.
Results. All of the sources with large-scale gas structures also exhibit some reflection nebulosity in their vicinity. Similarly, at least five Class II objects associated with a prominent RNe, and for which adequate ALMA observations are available, were found to have spirals or stream-like structures which may be due to late infall. We report the first detection of these structures around S CrA.
Conclusions. Our results suggest that a non-negligible fraction of Class II disks in nearby star-forming regions may be associated with RNe and could therefore be undergoing late accretion of gas. Surveys of RNe and kilo-au scale gas structures around Class II sources will allow us to better understand the frequency and impact of late-infall phenomena.
Key words: planets and satellites: formation / ISM: clouds / protoplanetary disks / stars: formation
© The Authors 2023
 Open Access article, published by EDP Sciences, under the terms of the Creative Commons Attribution License (https://creativecommons.org/licenses/by/4.0), which permits unrestricted use, distribution, and reproduction in any medium, provided the original work is properly cited.
This article is published in open access under the Subscribe-to-Open model. This email address is being protected from spambots. You need JavaScript enabled to view it. to support open access publication.
1. Motivation
Most stars are born in groups in giant molecular clouds through the gravitational collapse of dense molecular cores (McKee & Ostriker 2007). As these protostellar systems evolve from the Class 0/I to the Class II stage, the surrounding gaseous envelope is thought to be completely dispersed and, traditionally, Class II systems are believed to evolve in general isolation to form planetary systems.
However, in reality, these systems are still in the vicinity of molecular clouds on large scales (≳1 pc) and may continue to dynamically interact with them. Such interactions were observed in younger Class 0/I objects, where 1000 au scale streamers of molecular gas infalling onto the protostar were detected (e.g., Pineda et al. 2020; Alves et al. 2020; Garufi et al. 2022). There have been some recent serendipitous detections of ∼1000 au, generally stream-like, gaseous structures around Class II disks too, which are likely due to such interactions (Tang et al. 2012; Ginski et al. 2021; Huang et al. 2020, 2021, 2022).
Late infall of material can greatly influence the physical and chemical properties of Class II disks, and thus, of the planets they form. For example, the supply of fresh material can help solve the ‘mass-budget problem’ of planet-forming disks (e.g., Manara et al. 2018; Mulders et al. 2021), and explain the observed chemical diversity among meteorites (Nanne et al. 2019). Thies et al. (2011) and Kuffmeier et al. (2021) demonstrated that late infall can torque disks and explain the observed misalignment of some planetary systems. Approximated as Bondi-Hoyle accretion (Bondi & Hoyle 1944), late infall can explain the steep dependence of mass accretion on stellar mass (Padoan et al. 2005, 2014). Finally, this phenomenon may also produce disk sub-structures and instabilities as seen in vortices (Bae et al. 2015; Kuznetsova et al. 2022), spiral waves (Hennebelle et al. 2017; Kuffmeier et al. 2018), and FU Orionis outbursts (Dullemond et al. 2019).
A characterisation of the frequency and efficiency of late infall is therefore crucial for establishing a holistic view of the star and planet formation process. Simulations suggest that a signpost of such accretion events could be ∼103 au-scale arc-shaped structures, generally referred to as ‘streamers’ (e.g., Kuffmeier et al. 2020). However, only a few have been detected, mainly because these spatial scales lie at the limits of single-dish resolution and they are largely filtered out in interferometric observations designed to resolve protoplanetary disks. To comprehensively study late-stage infall, a survey of large-scale structures around Class II sources is needed and a first step in this direction would be to systematically identify suitable targets.
In order to find disks that are potentially undergoing late infall, one should first identify Class II sources that are close enough to clouds to gravitationally interact with them. Such clouds will scatter the protostellar light in optical and near-infrared (NIR) wavelengths and appear as reflection nebulae (RNe) (e.g., Hubble 1922). Historically, RNe were used to identify young stellar objects (YSOs) (e.g., Cohen 1980) and they were indeed one of the original defining characteristics of T Tauri stars (Joy 1945). Recently, hydrodynamical simulations have demonstrated that kilo-au scale RNe can appear due to cloud-protostar interactions, some of which lead to late infall of material (Dullemond et al. 2019). In this Letter we pioneer the use of RN detections close to Class II stars to identify late-infall candidates.
2. Class II sources with large-scale CO structures
Large-scale non-Keplerian gaseous structures have been detected around a few Class II sources. In order to test the hypothesis that RNe might indicate late infall, we looked for signs of nebulosity around these sources, as discussed below:
AB Aur.Tang et al. (2012) found four ∼500 au spirals around AB Aur in CO observations using the Instituto de Radioastronomía Milimétrica (IRAM) 30-m telescope, Plateau de Bure interferometer (PbDI), and Submillimeter Array (SMA). Analysis of the gas kinematics in these spirals, which seems to be counter-rotating with respect to the Keplerian disk, suggests that they are likely formed due to late-stage infall of gas. This source is also known to be associated with a bright arc-shaped RN (e.g., Dullemond et al. 2019), as shown in Fig. 1 (panel a).
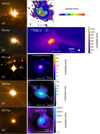 |
Fig. 1. Optical and NIR images (left) and 12CO integrated intensity moment 0 maps (right) of Class II sources with known large-scale structures, as discussed in Sect. 2. Panel a: AB Aur’s DSS2 optical image and the PdBI 12CO (2–1) moment 0 map from Tang et al. (2012). Panel b: SU Aur’s Pan-STARRS optical image and the ALMA 12CO (3–2) moment 0 map from Ginski et al. (2021). Panel c: RU Lup’s DSS2 (red) optical image and the ALMA 12CO (2–1) moment 0 map from Huang et al. (2020). Panel d: GM Aur’s HST (NICMOS) NIR image and the ALMA 12CO (2–1) moment 0 map from Huang et al. (2021). Panel e: DO Tau’s Pan-STARRS optical image and ALMA 12CO (2–1) moment 0 map from Huang et al. (2022). Angular resolutions for the moment 0 maps are roughly 0.5″, 0.3″, 0.3″, 0.2″, and 0.7″ for panels a to e, respectively. |
SU Aur.Akiyama et al. (2019) reported an ∼1000 au long tail-like streamer using the Atacama Large Millimeter/submillimeter Array (ALMA) in CO emission. Later, Ginski et al. (2021) studied the morphology of its dust tails in scattered light using the Very Large Telescope (VLT), along with a kinematic study of CO gas, and found that the material is likely moving towards the disk. A bright RN is visible in the immediate vicinity of SU Aur (Fig. 1, panel b).
RU Lup.Huang et al. (2020) reported at least five CO spiral arms stretching up to ∼1000 au around RU Lup using ALMA observations and suggested late infall as a possible explanation. Archival Digital Sky Survey (DSS) images show faint nebulosity just north of RU Lup, as shown in Fig. 1 (panel c).
GM Aur.Huang et al. (2021) found extended elongated structures around GM Aur, ∼1000–2000 au in length, using ALMA CO observations with a morphology and kinematics indicative of late infall. No RNe have been found in archival DSS or Panoramic Survey Telescope and Rapid Response System (Pan-STARRS) images, but there are elongated features in more sensitive Hubble Space Telescope (HST) NIR images, as reported in Schneider et al. (2003) and shown in Fig. 1 (panel d).
DO Tau.Huang et al. (2022) studied the kilo-au environment of DO Tau using VLT/SPHERE, HST, and ALMA observations, and found the disk to be connected to multiple ∼1000 au scale stream-like structures. Larger-scale Herschel observations show that these structures are probably due to an interaction with the neighbouring YSO HV Tau, but late accretion of material onto DO Tau is not ruled out. The source is associated with a prominent RN (Fig. 1, panel e).
To summarise, the five known Class II sources that have large-scale CO structures suggestive of an interaction with surrounding gas have either a prominent RN or some hints of reflection nebulosity. Following this lead, we exploit the association of YSOs with RNe to search for candidate Class II sources undergoing late-stage infall of material.
3. Class II sources near reflection nebulae
As a first step, we compiled a catalogue of RNe using the published lists in Magakian (2003) and Connelley et al. (2007). Magakian (2003) merged previously published RNe catalogues and presented a final list of 913 objects. Most of the sources in their list have been manually identified by visual inspection of DSS optical images. Connelley et al. (2007) surveyed 197 nearby, mostly Class I, protostars at 2.2 μm using the University of Hawaii 2.2 m telescope. They detected 106 RNe, out of which 41 were reported as new discoveries. The fact that ≳40% of RNe were not detected before suggests that the previous RNe catalogues were rather incomplete. For example, the prominent RNe around SU Aur (see Fig. 1, panel b) and HD 100546 (Ardila et al. 2007) were not in these RNe catalogues.
Connelley et al. (2007) estimated sizes of RNe as the square root of their area with a mean (μ) and standard deviation (σ) of ∼18″ and ∼15″, respectively. Using a cross-matching radius of 30″ (∼μ + 1σ), we found ten RNe present in both of the catalogues. After removing duplicates, we merged the two catalogues to have a final sample of 1009 RNe.
To avoid spurious detections and have a well-characterised sample of YSOs with RNe that can be further followed up on using molecular-line observations (as discussed in Appendix D), we focus on nearby well-studied star-forming regions (SFRs). The regions considered in this study are listed in Table 1 and shown in Fig. A.1. The radii reported in the fifth column in Table 1 were used to define circular boundaries around the central coordinates listed in the second and third columns, and they are marked with black circles in Fig. A.1. We found 141 sources from our catalogue of 1009 RNe within these region boundaries.
List of SFRs considered in this study.
The next step was to compile a catalogue of YSOs in these regions. For this we started with the all-sky catalogue of 133 980 Class I/II sources reported in Marton et al. (2016). Marton et al. (2016) analysed WISE and 2MASS photometry of these sources, using the support vector machine algorithm to identify them as YSOs. For a more complete sample of nearby YSOs, we also used the list of 2966 YSOs identified using Spitzer’s ‘cores to disks’ and ‘Gould Belt’ surveys, as reported in Dunham et al. (2015). Among the SFRs considered in this study, Taurus and Orion were not part of the Dunham et al. (2015) catalogue. Using a cross-matching radius of 5″, we found 781 common sources in both datasets. Our final catalogue consists of 136 165 YSOs of which 4930 lie within the SFR boundaries.
The spectral indices, α, or slope of the spectral energy distributions in the infrared regime (∼2–25 μm) were given in the Dunham et al. (2015) catalogue. We used their values, α′, corrected for foreground extinction to classify the source evolutionary state.
Similarly, we determined α for sources exclusively in the Marton et al. (2016) catalogue using the provided WISE and 2MASS (K band) photometry, and discarding those with fitting uncertainties > 0.6, that is roughly half of the range of values for Class II sources. In order to estimate extinction-corrected spectral indices (α′), we computed a correction factor of −0.31 as the median of differences between all the α′ and α values reported in Dunham et al. (2015). We note that this method only provides a rough estimate of α′ as it does not account for extinction values for individual sources. A comparison of our α and α′ values is shown in Fig. B.1. Following the same classification criteria as Dunham et al. (2015), that is −1.6 ≤ α′< − 0.3, 2562 out of 4930 YSOs in our SFRs were classified as Class II sources.
The next step was to cross match our list of Class II sources with the merged catalogue of RNe. For the specific goal of this work, the cross-matching distance between a YSO and RN can be empirically estimated as the length scale from where ambient gas can be accreted onto an isolated star (Bondi–Hoyle accretion, Bondi & Hoyle 1944; Throop & Bally 2008; Padoan et al. 2014). The typical length scale for this interaction is given as LBH = 2GM∗/v2, where G is the gravitational constant, M* is the stellar mass, and v is the stellar speed relative to the gas. For a stellar mass of 1 M⊙ and typical stellar velocity of 1 km s−1, LBH ∼ 2000 au. The 21 late-infall Class II candidates that we found using this threshold are listed in Appendix C.
We note that this distance threshold is a lower limit for an interaction between clouds and YSOs because we do not account for the sizes of RNe. These show a range of physical sizes (∼103–105 au) and have highly asymmetrical shapes (e.g., Connelley et al. 2007). When mining the ALMA archive, we ignored this diversity as we aimed to identify a reliable sample of YSOs potentially interacting with RNe clouds. The implications of a more realistic distance threshold is discussed in Sect. 4.
ALMA archive search. To target higher-quality observations, we focussed on nearby SFRs (d ≲ 200 pc), where 16 out of the 21 Class II disks near RNe are located. For these nearby sources, we searched for existing observations in the ALMA Science Archive. We are primarily interested in 12CO emission (J = 2 − 1 in Band 6 and J = 3 − 2 in Band 7) since this molecule is expected to be a good tracer of large-scale diffuse gas structures (see e.g., Fig. 1). We found a total of 66 Band 6 and 7 observations for 16 sources in our sample, as shown in Fig. 2.
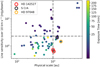 |
Fig. 2. Largest recoverable physical scale vs line sensitivity (over 10 km s−1) for archival ALMA observations, in Band 6 and 7, of the 16 nearby Class II YSOs associated with RNe, as discussed in Sect. 3. Marker colours denote the exposure time for each observation in minutes. The vertical dashed line denotes a recoverable scale of 1000 au. The horizontal dashed line denotes a line sensitivity of 2.3 mJy beam−1 (the line sensitivity reported in the ALMA archive for SU Aur observations by Ginski et al. 2021). Markers with open circles denote the observations discussed in Sect. 3, with red circles for HD 142527, black circle for S CrA, and an orange circle for HD 97048. |
Among these datasets, we found 13 observations with the largest angular scale (LAS) corresponding to at least 1000 au to recover the expected large-scale structures (see Kuffmeier et al. 2020). As such large-scale structures are expected to have low column densities, and therefore faint emission, the observational sensitivity is important. We selected a subset of five observations with rms noise (over a channel width of 10 km s−1) smaller than a 2.3 mJy beam−1, equal to the line sensitivity reported in the ALMA archive for SU Aur observations (Ginski et al. 2021). For the typical angular resolution of 0.7″ for these observations, the sensitivity threshold of the 2.3 mJy beam−1 corresponds to ∼100 mK. The sensitivity and recoverable scale thresholds are marked as dashed-grey lines in Fig. 2.
Among these five observations, two targeted HD 142527 (Fig. 2, red circles), a well-studied binary Class II system. These data have been published and show non-Keplerian spiral structures extending to ∼700 au, beyond the disk radius of ∼200–300 au (Christiaens et al. 2014; Garg et al. 2021), as shown in Fig. 3 (panel a). Similar structures have also been observed in optical and NIR images (Casassus & Perez 2012; Hunziker et al. 2021). Christiaens et al. (2014) suggested that the innermost spiral can be explained by acoustic waves due to an embedded companion; however, the origin of the outer spirals is less clear, and stellar encounters and gravitational instabilities have been suggested as possible causes. We note that spiral structures have been predicted to form due to late infall (Hennebelle et al. 2017; Kuffmeier et al. 2017, 2018) and a detailed kinematic analysis can be done to distinguish among these scenarios, as discussed in Appendix D. HD 142527 also exhibits inner and outer disk misalignment (Bohn et al. 2022), which can be explained by late infall (Thies et al. 2011; Kuffmeier et al. 2021).
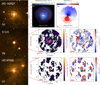 |
Fig. 3. Optical images (left), 12CO integrated intensity (moment 0) maps (middle), and 12CO intensity-weighted velocity (moment 1) maps (right) of nearby Class II sources associated with RNe, as discussed in Sect. 3. Panel a: HD 142527’s DSS optical image and the ALMA 12CO (2–1) moment maps from Garg et al. (2021). Panel b: S CrA’s DSS2 (red) optical image and the ALMA 12CO (2–1) moment maps. Solid and dashed curved-cyan lines denote prominent and potential streamer-like features, respectively. Panel c: HD 97048’s DSS optical image and the ALMA 12CO (2–1) moment maps. For the moment maps (middle and right) in panel b and c, only pixels with an intensity > 3σ are considered. In these panels, green contours represent continuum emission (∼1.3 mm, 3σ and 15σ levels) from protoplanetary disks, horizontal red lines in the bottom-left corner represent a 1000 au length scale, the grey ellipse in the bottom-right corner represent the beam size, and black contours in moment 1 maps (right) represent moment 0 emission (starting from the error in moment 0, increased by a factor of five). Errors in moment 0 emission are 22.1 and 20.6 mJy beam−1 km s−1 for S CrA and HD 97048, respectively. |
The other three datasets are of S CrA, HD 97048, and Sz 68. The selected large-scale observation for Sz 68 (Project 2019.1.01135.S) does not cover any CO lines and is therefore not discussed further. For S CrA (Project 2019.1.01792.S) and HD 97048 (Project 2015.1.00192.S), we used the standard pipeline calibration and imaged the 12CO (2–1) data using CASA 6.4. For both datasets, imaging was carried out using ‘briggs’ weighting with robust=0.5, a cell size of 0.05″, and ‘auto-multithresh’ masking with default parameters. The resulting integrated intensity (moment 0) maps and intensity-weighted velocity (moment 1) maps are shown in Fig. 3 (panel b and c). Appendix F shows corresponding channel maps for both of the datasets.
For S CrA, at least one ∼1000 au streamer is clearly visible (solid cyan line), north-west of the binary disks (green contours), as seen in the moment 0 map (Fig. 3, panel b, middle panel). This streamer seems to be redshifted with respect to the disk emission, as seen in the corresponding moment 1 map (see Fig. 3, panel b, right panel and channels from 12.93 to 8.57 km s−1 in Fig. F.1). Furthermore, there are hints of two more streamers, denoted as dashed-cyan lines in the moment 0 map (Fig. 3, panel b, middle panel). This is the first discovery of large-scale streamers around S CrA. As discussed in Sect. 2, such elongated structures can form due to the late infall of material, but they could also be a consequence of a binary interaction. Further analysis is required to ascertain the dynamical nature of these features and will follow in a future publication.
For HD 97048, no clear streamers are visible in the moment 0 map (Fig. 3, panel c, middle panel). However, significant negative emission was observed in the central channels (Fig. F.2, channels 5.32–3.57 km s−1), suggesting that the source may be surrounded by large-scale gas that may absorb or otherwise obscure, through spatial filtering, kilo-au features around the star.
These initial results suggest that at least two (HD 142527 and S CrA) out of the three Class II sources associated with RNe, and with good-enough ALMA data, exhibit large-scale spirals or streamer-like structures, as are expected to form due to cloud-disk interactions, particularly late-stage infall of material (Hennebelle et al. 2017; Dullemond et al. 2019; Kuffmeier et al. 2017, 2020; Kuznetsova et al. 2020). These two sources are in addition to the already known similar sources discussed in Sect. 2. Other possible explanations for these large-scale structures are discussed in Appendix E. Irrespective of the actual origin of such features, it is promising to see that large-scale gas emission is found around YSOs close to RNe. This may indicate that an association with RNe can be used to look for similar structures around a wider population of Class II disks, as discussed further in Sect. 4.
4. Discussion
We have found 21 Class II sources associated with RNe in the SFRs listed in Table 1, using a distance threshold of ∼2000 au, equivalent to the typical Bondi-Hoyle accretion length scale. However, this distance threshold does not account for the observed range of physical extents and asymmetric shapes of RNe. Connelley et al. (2007) provided angular sizes and distances for RNe in their catalogue, which correspond to a mean radius ∼104 au. The exact distances between the centres of YSOs and RNe that result in late infall can vary greatly for different sources depending on their stellar (mass and velocity) and RNe properties (size and shape) and it is likely that more Class II sources in our sample may be interacting with neighbouring material than discussed here.
Figure A.2 plots the fraction of Class II sources and all YSOs associated with RNe as a function of the offset distance for different SFRs. Considerable differences can be seen in the association probability of YSOs with RNe for different SFRs, mostly due to different catalogue completeness levels. The incompleteness of the available RNe catalogues is a major obstacle in providing reliable statistics at the moment (see discussion in Sect. 3). However, even with this limitation, it is clear that there are potentially many Class II disks interacting with their parent cloud. For at least four SFRs (Taurus, Lupus, Corona Aurstralis, and Chamaeleon), ∼5–10% of Class II sources are close-enough (≲104 au) to RNe. If the threshold is slightly increased to ≲4 × 10⁴ au, ∼50% of Class II sources in Corona Aurstralis would be associated with a RN, and therefore potentially accreting material from the ambient cloud.
Accounting for stellar kinematics, the number of Class II systems that pass by RNe at some point in their lifetime could be even greater. If an association with RNe is indeed related to late infall, this may be an important phenomenon especially since it can have important implications for disk evolution and planet formation, as described in Sect. 1. To further test the tentative link between RNe and an interaction between disks and surrounding clouds, a survey of structures and kinematics around Class II sources with known RNe is needed, as discussed in Appendix D. Coupled with a better RNe catalogue, such a survey will allow us to understand how frequent late infall is for Class II sources.
5. Conclusions
In this Letter we pioneer the use of the detections of RNe close to Class II stars to identify late-infall candidates. We find that all of the sources with known large-scale CO structures, where late infall is invoked as a possible explanation, also exhibit some reflection nebulosity at OIR wavelengths. Furthermore, at least five out of the six sources which are associated with a prominent RNe and for which adequate ALMA observations are available – that is, known sources AB Aur, SU Aur, and DO Tau along with independently identified sources S CrA and HD 142527 – exhibit some large scale structure that may be indicative of late infall. This per se suggests that association with RNe may be used to identify candidate Class II sources undergoing late-stage infall of material. Finally, in nearby SFRs, the fraction of Class II sources associated with RNe can be as large as 50%, depending on the distance threshold, but a proper statistical analysis is still pending improved RNe catalogues. If RNe are indeed related to late infall, this suggests that a significant fraction of Class II sources could be undergoing this phenomenon, with a non-negligible impact on disk evolution and planet formation. The catalogue of potential late accretors obtained serves as a starting point for more systematic studies of late infall onto disks.
Acknowledgments
This work was partly funded by the Deutsche Forschungsgemeinschaft (DFG, German Research Foundation) – 325594231. Funded by the European Union under the European Union’s Horizon Europe Research and Innovation Programme 101039452 (WANDA). T.B. acknowledges funding from the European Research Council (ERC) under the European Union’s Horizon 2020 research and innovation programme under grant agreement No 714769 and funding by the Deutsche Forschungsgemeinschaft (DFG, German Research Foundation) under grants 361140270, 325594231 (FOR 2634/2), and Germany’s Excellence Strategy – EXC-2094 – 390783311. M.K. gratefully acknowledges that this project has received funding from the European Union’s Framework Programme for Research and Innovation Horizon 2020 (2014-2020) under the Marie Skłodowska-Curie Grant Agreement No. 897524. This work was partly supported by the Italian Ministero dell’Istruzione, Università e Ricerca through the grant Progetti Premiali 2012-iALMA (CUP C52I13000140001), by the DFG Cluster of Excellence Origins (www.origins-cluster.de). This project has received funding from the European Union’s Horizon 2020 research and innovation program under the Marie Sklodowska-Curie grant agreement No 823823 (DUSTBUSTERS) and from the European Research Council (ERC) via the ERC Synergy Grant ECOGAL (grant 855130). Views and opinions expressed are however those of the author(s) only and do not necessarily reflect those of the European Union or the European Research Council. Neither the European Union nor the granting authority can be held responsible for them. This paper makes use of the following ALMA data: ADS/JAO.ALMA#2015.1.00192.S and ADS/JAO.ALMA#2019.1.01792.S. ALMA is a partnership of ESO (representing its member states), NSF (USA) and NINS (Japan), together with NRC (Canada), MOST and ASIAA (Taiwan), and KASI (Republic of Korea), in cooperation with the Republic of Chile. The Joint ALMA Observatory is operated by ESO, AUI/NRAO and NAOJ. This work made use of Astropy: (http://www.astropy.org) a community-developed core Python package and an ecosystem of tools and resources for astronomy (Astropy Collaboration 2013, 2018, 2022).
References
- Akiyama, E., Vorobyov, E. I., Liu, H. B., et al. 2019, AJ, 157, 165 [NASA ADS] [CrossRef] [Google Scholar]
- Alves, F. O., Cleeves, L. I., Girart, J. M., et al. 2020, ApJ, 904, L6 [NASA ADS] [CrossRef] [Google Scholar]
- Ardila, D. R., Golimowski, D. A., Krist, J. E., et al. 2007, ApJ, 665, 512 [Google Scholar]
- Astropy Collaboration (Robitaille, T. P., et al.) 2013, A&A, 558, A33 [NASA ADS] [CrossRef] [EDP Sciences] [Google Scholar]
- Astropy Collaboration (Price-Whelan, A. M., et al.) 2018, AJ, 156, 123 [Google Scholar]
- Astropy Collaboration (Price-Whelan, A. M., et al.) 2022, ApJ, 935, 167 [NASA ADS] [CrossRef] [Google Scholar]
- Bae, J., Hartmann, L., & Zhu, Z. 2015, ApJ, 805, 15 [NASA ADS] [CrossRef] [Google Scholar]
- Bohn, A. J., Benisty, M., Perraut, K., et al. 2022, A&A, 658, A183 [NASA ADS] [CrossRef] [EDP Sciences] [Google Scholar]
- Bondi, H., & Hoyle, F. 1944, MNRAS, 104, 273 [Google Scholar]
- Casassus, S., Perez, S. M., Jordán, A., et al. 2012, ApJ, 754, L31 [NASA ADS] [CrossRef] [Google Scholar]
- Christiaens, V., Casassus, S., Perez, S., van der Plas, G., & Ménard, F. 2014, ApJ, 785, L12 [NASA ADS] [CrossRef] [Google Scholar]
- Cohen, M. 1980, AJ, 85, 29 [Google Scholar]
- Connelley, M. S., Reipurth, B., & Tokunaga, A. T. 2007, AJ, 133, 1528 [NASA ADS] [CrossRef] [Google Scholar]
- Cuello, N., Dipierro, G., Mentiplay, D., et al. 2019, MNRAS, 483, 4114 [Google Scholar]
- Dong, R., Hall, C., Rice, K., & Chiang, E. 2015, ApJ, 812, L32 [Google Scholar]
- Dong, R., Liu, H. B., Cuello, N., et al. 2022, Nat. Astron., 6, 331 [NASA ADS] [CrossRef] [Google Scholar]
- Dullemond, C. P., Küffmeier, M., Goicovic, F., et al. 2019, A&A, 628, A20 [NASA ADS] [CrossRef] [EDP Sciences] [Google Scholar]
- Dunham, M. M., Allen, L. E., Evans, N. J. II., et al. 2015, ApJS, 220, 11 [NASA ADS] [CrossRef] [Google Scholar]
- Garg, H., Pinte, C., Christiaens, V., et al. 2021, MNRAS, 504, 782 [Google Scholar]
- Garufi, A., Podio, L., Codella, C., et al. 2022, A&A, 658, A104 [CrossRef] [EDP Sciences] [Google Scholar]
- Ginski, C., Facchini, S., Huang, J., et al. 2021, ApJ, 908, L25 [NASA ADS] [CrossRef] [Google Scholar]
- Hall, C., Dong, R., Teague, R., et al. 2020, ApJ, 904, 148 [NASA ADS] [CrossRef] [Google Scholar]
- Harsono, D., Alexander, R. D., & Levin, Y. 2011, MNRAS, 413, 423 [NASA ADS] [CrossRef] [Google Scholar]
- Hennebelle, P., Lesur, G., & Fromang, S. 2017, A&A, 599, A86 [NASA ADS] [CrossRef] [EDP Sciences] [Google Scholar]
- Huang, J., Andrews, S. M., Öberg, K. I., et al. 2020, ApJ, 898, 140 [NASA ADS] [CrossRef] [Google Scholar]
- Huang, J., Bergin, E. A., Öberg, K. I., et al. 2021, ApJS, 257, 19 [NASA ADS] [CrossRef] [Google Scholar]
- Huang, J., Ginski, C., Benisty, M., et al. 2022, ApJ, 930, 171 [NASA ADS] [CrossRef] [Google Scholar]
- Hubble, E. P. 1922, ApJ, 56, 400 [NASA ADS] [CrossRef] [Google Scholar]
- Hunziker, S., Schmid, H. M., Ma, J., et al. 2021, A&A, 648, A110 [NASA ADS] [CrossRef] [EDP Sciences] [Google Scholar]
- Joy, A. H. 1945, ApJ, 102, 168 [Google Scholar]
- Kuffmeier, M., Haugbølle, T., & Nordlund, Å. 2017, ApJ, 846, 7 [NASA ADS] [CrossRef] [Google Scholar]
- Kuffmeier, M., Frimann, S., Jensen, S. S., & Haugbølle, T. 2018, MNRAS, 475, 2642 [NASA ADS] [CrossRef] [Google Scholar]
- Kuffmeier, M., Goicovic, F. G., & Dullemond, C. P. 2020, A&A, 633, A3 [NASA ADS] [CrossRef] [EDP Sciences] [Google Scholar]
- Kuffmeier, M., Dullemond, C. P., Reissl, S., & Goicovic, F. G. 2021, A&A, 656, A161 [NASA ADS] [CrossRef] [EDP Sciences] [Google Scholar]
- Kurtovic, N. T., Pérez, L. M., Benisty, M., et al. 2018, ApJ, 869, L44 [Google Scholar]
- Kuznetsova, A., Hartmann, L., & Heitsch, F. 2020, ApJ, 893, 73 [NASA ADS] [CrossRef] [Google Scholar]
- Kuznetsova, A., Bae, J., Hartmann, L., & Mac Low, M.-M. 2022, ApJ, 928, 92 [NASA ADS] [CrossRef] [Google Scholar]
- Magakian, T. Y. 2003, A&A, 399, 141 [NASA ADS] [CrossRef] [EDP Sciences] [Google Scholar]
- Manara, C. F., Morbidelli, A., & Guillot, T. 2018, A&A, 618, L3 [NASA ADS] [CrossRef] [EDP Sciences] [Google Scholar]
- Marton, G., Tóth, L. V., Paladini, R., et al. 2016, MNRAS, 458, 3479 [Google Scholar]
- McKee, C. F., & Ostriker, E. C. 2007, ARA&A, 45, 565 [Google Scholar]
- Mulders, G. D., Pascucci, I., Ciesla, F. J., & Fernandes, R. B. 2021, ApJ, 920, 66 [NASA ADS] [CrossRef] [Google Scholar]
- Murillo, N. M., van Dishoeck, E. F., Hacar, A., Harsono, D., & Jørgensen, J. K. 2022, A&A, 658, A53 [NASA ADS] [CrossRef] [EDP Sciences] [Google Scholar]
- Nanne, J. A. M., Nimmo, F., Cuzzi, J. N., & Kleine, T. 2019, Earth Planet. Sci. Lett., 511, 44 [CrossRef] [Google Scholar]
- Padoan, P., Kritsuk, A., Norman, M. L., & Nordlund, Å. 2005, ApJ, 622, L61 [NASA ADS] [CrossRef] [Google Scholar]
- Padoan, P., Haugbølle, T., & Nordlund, Å. 2014, ApJ, 797, 32 [Google Scholar]
- Pineda, J. E., Segura-Cox, D., Caselli, P., et al. 2020, Nat. Astron., 4, 1158 [NASA ADS] [CrossRef] [Google Scholar]
- Rodriguez, J. E., Loomis, R., Cabrit, S., et al. 2018, ApJ, 859, 150 [Google Scholar]
- Schneider, G., Wood, K., Silverstone, M. D., et al. 2003, AJ, 125, 1467 [NASA ADS] [CrossRef] [Google Scholar]
- Stolker, T., Dominik, C., Min, M., et al. 2016, A&A, 596, A70 [NASA ADS] [CrossRef] [EDP Sciences] [Google Scholar]
- Tang, Y. W., Guilloteau, S., Piétu, V., et al. 2012, A&A, 547, A84 [NASA ADS] [CrossRef] [EDP Sciences] [Google Scholar]
- Thieme, T. J., Lai, S.-P., Lin, S.-J., et al. 2022, ApJ, 925, 32 [NASA ADS] [CrossRef] [Google Scholar]
- Thies, I., Kroupa, P., Goodwin, S. P., Stamatellos, D., & Whitworth, A. P. 2011, MNRAS, 417, 1817 [NASA ADS] [CrossRef] [Google Scholar]
- Throop, H. B., & Bally, J. 2008, AJ, 135, 2380 [NASA ADS] [CrossRef] [Google Scholar]
- Toomre, A. 1964, ApJ, 139, 1217 [Google Scholar]
- Valdivia-Mena, M. T., Pineda, J. E., Segura-Cox, D. M., et al. 2022, A&A, 667, A12 [NASA ADS] [CrossRef] [EDP Sciences] [Google Scholar]
- Vorobyov, E. I., Skliarevskii, A. M., Elbakyan, V. G., et al. 2020, A&A, 635, A196 [NASA ADS] [CrossRef] [EDP Sciences] [Google Scholar]
- Yen, H.-W., Gu, P.-G., Hirano, N., et al. 2019, ApJ, 880, 69 [NASA ADS] [CrossRef] [Google Scholar]
- Zapata, L. A., Rodríguez, L. F., Fernández-López, M., et al. 2020, ApJ, 896, 132 [Google Scholar]
- Zucker, C., Speagle, J. S., Schlafly, E. F., et al. 2020, A&A, 633, A51 [NASA ADS] [CrossRef] [EDP Sciences] [Google Scholar]
Appendix A: Star-forming regions
Figure A.1 shows DSS optical images of all the SFRs listed in Table 1, as discussed in Section 3. Figure A.2 shows fraction of all YSOs (solid lines) and just Class II sources (dashed lines) which are associated with RNe as a function of offset thresholds used to define association, as discussed in Section 4.
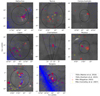 |
Fig. A.1. DSS optical images of all the SFRs listed in Table 1. Solid-black curves denotes circular boundaries of these SFRs, as parameterized by the "Radius" column of Table 1. Blue and purple circles represent YSOs from Marton et al. (2016) and Dunham et al. (2015) catalogues, respectively. Red and yellow open diamonds represent RNe from Magakian (2003) and Connelley et al. (2007) catalogues, respectively. Dashed-black curve in Chamaeleon’s map denote a circle with radius of 20°. |
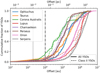 |
Fig. A.2. Cumulative distribution of the fraction of YSOs with distance to the nearest RNe less than the given offset, as discussed in Section 4, for different SFRs. Solid lines represent all the YSOs and dashed lines represent only Class II sources. Vertical dotted and dash-dotted lines denote offset values of 2000 and 10000 au, respectively. |
Appendix B: Distribution of spectral indices
Figure B.1 shows the distribution of extinction-corrected spectral indices (α’, solid bars) and originally measured spectral indices (α, dashed-grey line), as discussed in Section 3. The distribution of α values are shifted to the right because foreground extinction can artificially increase the observed infrared excess for a source.
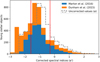 |
Fig. B.1. Distribution of extinction-corrected infrared spectral indices (α’, solid bars) and measured spectral indices (α, grey-dashed steps) for all the 4930 YSOs in SFRs, as discussed in Section 4. Blue bars denote α’ values estimated for sources exclusively from Marton et al. (2016). Orange bars denote α’ values for sources from Dunham et al. (2015). Red vertical lines mark the range of values for a YSO to be classified as a Class II source (−1.6 ≤ α′< − 0.3). |
Appendix C: Class II sources near RNe
Table C.1 gives coordinates (first two columns), SIMBAD identifiers (third column), the SFR (fourth column), spectral indices (fifth and sixth columns), and RNe catalogue identifiers (last two columns) for all the Class II sources in the vicinity of RNe, as discussed in Section 3.
Class II YSOs associated with RNe
Appendix D: Required observations and analysis
In order to further test a possible link between RNe and late infall, a deep uniform survey of large-scale structures is needed for Class II sources associated with RNe, as suggested in Section 4. Ideal observational parameters for such a survey are discussed below.
For what concerns the angular scales, both observations (Figure 1) and simulations (e.g. Kuffmeier et al. 2020) suggest that the infalling streamers should be roughly kilo-au scales in length. Therefore, observations needed to study these structures should have a large enough maximum recoverable angular scale (≳1000 au), so as to not filter out large-scale emission. For the typical distance of 150 pc to nearby SFRs, this physical scale corresponds to the largest angular scale of ≳7″. On the other hand, spatial resolution of such observations should be roughly ≲100 au (≲0.7″ at a distance of 150 pc), in order to resolve the connection between large-scale structures and protoplanetary disks. Such a resolution should also be adequate to resolve the width of infalling streamers (Figure 1).
In terms of spectral resolution, free-fall velocity for the infall of material can be estimated as  , where G is the gravitational constant, M* is the stellar mass, and R is the free-fall length scale. For the typical stellar mass of ∼0.5M⊙ and expected infall length scale of ∼1, 000 au, the free-fall velocity should be ∼0.95 km s−1. Assuming we see such an infalling streamer at an intermediate inclination of 45°, observed velocity difference would be ∼0.65 km s−1. In order to resolve the velocity profile, we would need at least three independent data points, and thus a spectral resolution of ≲0.2 km s−1.
The sensitivity requirements of the ideal observations can be based on the past observations of such large-scale structures. Among the five sources discussed in Section 2, AB Aur and SU Aur are exceptionally bright and may not be representatives for the overall sample. For RU Lup, the signal-to-noise ratio for the spiral structures was sub-optimal (≲3) in the individual channel (see Figure 5, Huang et al. 2020), which can make it hard to study the background dynamical processes. Thus, sensitivity requirements of the observations can be based on observations of GM Aur and DO Tau, and for both of which the brightness-temperature sensitivity was ∼250 mK (normalised to a channel width of 0.2 km s−1).
If large-scale structures are observed around other Class II sources, gas kinematics can be analysed to understand the dominant dynamical processes. A first step could be to check if the material is gravitationally bound to the protostellar system. For this the kinetic energy can be computed along the streamer, using the relative line-of-sight velocities, and compared to gravitational energy, similar to the analysis done for DO Tau by Huang et al. (2022) (see Figure 12). Furthermore, position-velocity diagrams, along any detected streamer, can be modelled and compared to the velocity profiles expected for different kinematic features such as rotation (v ∝ R−1, for conserved angular momentum) and infall (v ∝ R−0.5, for free fall), similar to the analysis done for less evolved protostars HL Tau (Yen et al. 2019) and Lupus 3-MMS (Thieme et al. 2022).
Another way to infer late infall could be to study gas kinematics together with NIR polarisation observations, as was done for SU Aur by Ginski et al. (2021). The degree of polarisation in such observations can be correlated to the dust scattering angles, which are expected to depend on the three-dimensional morphology of dust structures (e.g. Stolker et al. 2016). Studying the morphology and gas kinematics in larger-scale (∼10, 000 au) clouds can also allow us to judge the possibility of late infall (Tang et al. 2012; Dullemond et al. 2019).
Finally, late infall can also be inferred by observing these systems using different chemical species. Though CO has a high surface brightness, making it ideal to detect faint structures, it is also likely to be polluted by the emission from diffuse gas in these clouds. For less evolved sources, infalling streamers have also been observed in tracers such as HCO+, HC3N, HC5N, CCS, 13CS, HNC, and H2CO (Yen et al. 2019; Pineda et al. 2020; Murillo et al. 2022; Valdivia-Mena et al. 2022). Moreover, material falling onto protoplanetary disks also creates shocks, which can be observed using shock tracers such as SiO, SO, and SO2 (e.g. Garufi et al. 2022). A dedicated chemical study of streamers could also allow us to identify better chemical tracers for these structures for a large-scale survey.
Appendix E: Alternative explanations for large-scale structures
The large-scale CO structures discussed in Section 2 and 3 could also be due to other dynamical processes besides late infall (e.g. Huang et al. 2020). One of the other prominent causes, particularly for spiral-like structures, could be a tidal interaction of stellar companions, as it has been observed in some other multiple systems (e.g. Rodriguez et al. 2018; Kurtovic et al. 2018; Zapata et al. 2020). The two sources we found with large-scale structures, HD 142527 and S CrA (Section 3), are binaries, and thus some of the structures we observe around them (Figure 3, panel a and c) could be due to tidal interactions between protostars and surrounding gas.
Furthermore, such structures can also be created due to close encounters by neighbouring YSOs, as predicted by several hydrodynamic simulations (e.g. Cuello et al. 2019; Vorobyov et al. 2020) and likely observed for a few sources (e.g. Dong et al. 2022). The role of these stellar flybys can be checked by looking at relative distances and velocities of nearby YSOs, as was done for SU Aur (Ginski et al. 2021, Appendix D).
Gravitational instabilities can be another possible way to form spiral-like structures, if the disks are massive enough (e.g. Dong et al. 2015), as generally inferred by Toomre’s Q parameter (Toomre 1964). Such instabilities are expected to leave characteristic ’wiggle’ signatures in the gas kinematics, which can be used to identify them (Hall et al. 2020). Moreover, Harsono et al. (2011) showed that such instabilities can also be triggered by the infall of material. Irrespective of the cause of such non-Keplerian structures, both approaches followed in Sec. 2 and in Sec. 3 suggest that the vicinity of a RN can be an effective criterion to identify Class II disks that present large-scale structures.
Appendix F: Channel maps
Figure F.1 and F.2 show channels maps of S CrA and HD 97048, respectively, as discussed in Section 3.
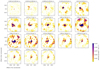 |
Fig. F.1. ALMA 12CO (2–1) channel maps for S CrA archival observations (Project code: 2019.1.01792.S). Emission only from pixels with an intensity > 2σ was considered. Grey ellipses in the bottom right corners of the maps represent the beam size. |
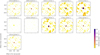 |
Fig. F.2. ALMA 12CO (2–1) channel maps for HD 97048 archival observations (Project code: 2015.1.00192.S). Emission only from pixels with an intensity > 2σ was considered. Grey ellipses in bottom right corners of the maps represent the beam size. |
All Tables
All Figures
|
Fig. 1. Optical and NIR images (left) and 12CO integrated intensity moment 0 maps (right) of Class II sources with known large-scale structures, as discussed in Sect. 2. Panel a: AB Aur’s DSS2 optical image and the PdBI 12CO (2–1) moment 0 map from Tang et al. (2012). Panel b: SU Aur’s Pan-STARRS optical image and the ALMA 12CO (3–2) moment 0 map from Ginski et al. (2021). Panel c: RU Lup’s DSS2 (red) optical image and the ALMA 12CO (2–1) moment 0 map from Huang et al. (2020). Panel d: GM Aur’s HST (NICMOS) NIR image and the ALMA 12CO (2–1) moment 0 map from Huang et al. (2021). Panel e: DO Tau’s Pan-STARRS optical image and ALMA 12CO (2–1) moment 0 map from Huang et al. (2022). Angular resolutions for the moment 0 maps are roughly 0.5″, 0.3″, 0.3″, 0.2″, and 0.7″ for panels a to e, respectively. |
| In the text | |
|
Fig. 2. Largest recoverable physical scale vs line sensitivity (over 10 km s−1) for archival ALMA observations, in Band 6 and 7, of the 16 nearby Class II YSOs associated with RNe, as discussed in Sect. 3. Marker colours denote the exposure time for each observation in minutes. The vertical dashed line denotes a recoverable scale of 1000 au. The horizontal dashed line denotes a line sensitivity of 2.3 mJy beam−1 (the line sensitivity reported in the ALMA archive for SU Aur observations by Ginski et al. 2021). Markers with open circles denote the observations discussed in Sect. 3, with red circles for HD 142527, black circle for S CrA, and an orange circle for HD 97048. |
| In the text | |
|
Fig. 3. Optical images (left), 12CO integrated intensity (moment 0) maps (middle), and 12CO intensity-weighted velocity (moment 1) maps (right) of nearby Class II sources associated with RNe, as discussed in Sect. 3. Panel a: HD 142527’s DSS optical image and the ALMA 12CO (2–1) moment maps from Garg et al. (2021). Panel b: S CrA’s DSS2 (red) optical image and the ALMA 12CO (2–1) moment maps. Solid and dashed curved-cyan lines denote prominent and potential streamer-like features, respectively. Panel c: HD 97048’s DSS optical image and the ALMA 12CO (2–1) moment maps. For the moment maps (middle and right) in panel b and c, only pixels with an intensity > 3σ are considered. In these panels, green contours represent continuum emission (∼1.3 mm, 3σ and 15σ levels) from protoplanetary disks, horizontal red lines in the bottom-left corner represent a 1000 au length scale, the grey ellipse in the bottom-right corner represent the beam size, and black contours in moment 1 maps (right) represent moment 0 emission (starting from the error in moment 0, increased by a factor of five). Errors in moment 0 emission are 22.1 and 20.6 mJy beam−1 km s−1 for S CrA and HD 97048, respectively. |
| In the text | |
|
Fig. A.1. DSS optical images of all the SFRs listed in Table 1. Solid-black curves denotes circular boundaries of these SFRs, as parameterized by the "Radius" column of Table 1. Blue and purple circles represent YSOs from Marton et al. (2016) and Dunham et al. (2015) catalogues, respectively. Red and yellow open diamonds represent RNe from Magakian (2003) and Connelley et al. (2007) catalogues, respectively. Dashed-black curve in Chamaeleon’s map denote a circle with radius of 20°. |
| In the text | |
|
Fig. A.2. Cumulative distribution of the fraction of YSOs with distance to the nearest RNe less than the given offset, as discussed in Section 4, for different SFRs. Solid lines represent all the YSOs and dashed lines represent only Class II sources. Vertical dotted and dash-dotted lines denote offset values of 2000 and 10000 au, respectively. |
| In the text | |
|
Fig. B.1. Distribution of extinction-corrected infrared spectral indices (α’, solid bars) and measured spectral indices (α, grey-dashed steps) for all the 4930 YSOs in SFRs, as discussed in Section 4. Blue bars denote α’ values estimated for sources exclusively from Marton et al. (2016). Orange bars denote α’ values for sources from Dunham et al. (2015). Red vertical lines mark the range of values for a YSO to be classified as a Class II source (−1.6 ≤ α′< − 0.3). |
| In the text | |
|
Fig. F.1. ALMA 12CO (2–1) channel maps for S CrA archival observations (Project code: 2019.1.01792.S). Emission only from pixels with an intensity > 2σ was considered. Grey ellipses in the bottom right corners of the maps represent the beam size. |
| In the text | |
|
Fig. F.2. ALMA 12CO (2–1) channel maps for HD 97048 archival observations (Project code: 2015.1.00192.S). Emission only from pixels with an intensity > 2σ was considered. Grey ellipses in bottom right corners of the maps represent the beam size. |
| In the text | |
Current usage metrics show cumulative count of Article Views (full-text article views including HTML views, PDF and ePub downloads, according to the available data) and Abstracts Views on Vision4Press platform.
Data correspond to usage on the plateform after 2015. The current usage metrics is available 48-96 hours after online publication and is updated daily on week days.
Initial download of the metrics may take a while.