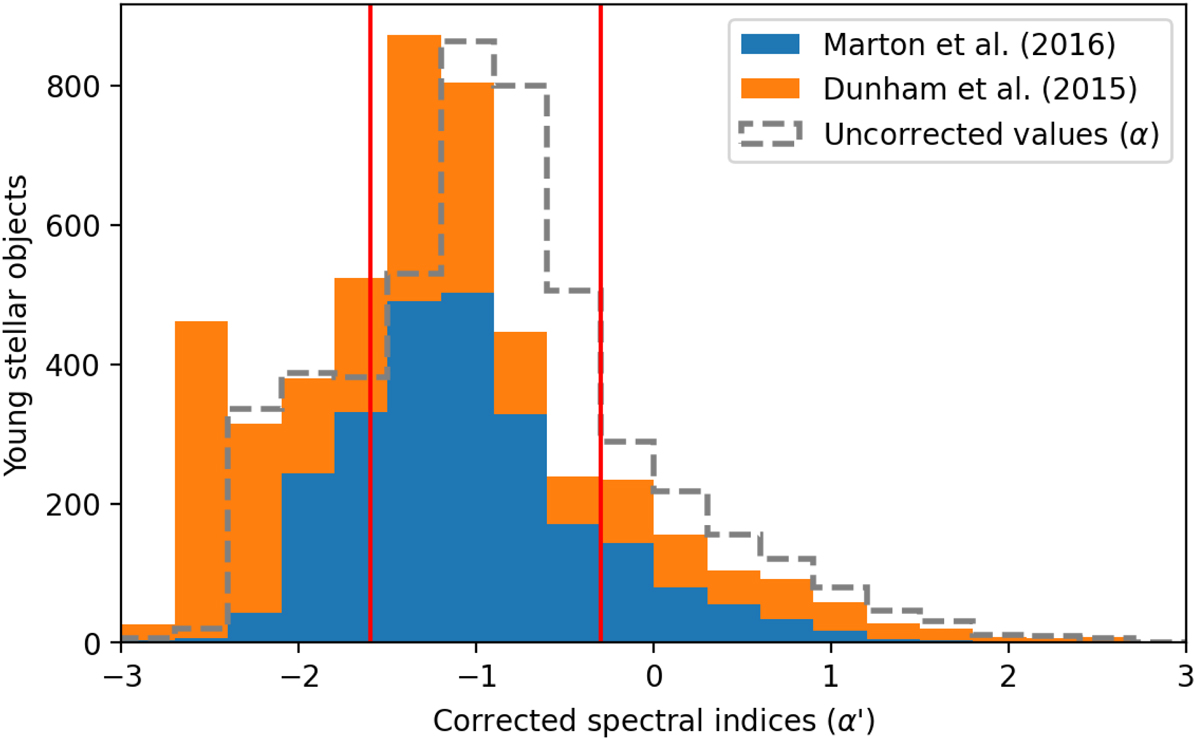
Fig. B.1.
Download original image
Distribution of extinction-corrected infrared spectral indices (α’, solid bars) and measured spectral indices (α, grey-dashed steps) for all the 4930 YSOs in SFRs, as discussed in Section 4. Blue bars denote α’ values estimated for sources exclusively from Marton et al. (2016). Orange bars denote α’ values for sources from Dunham et al. (2015). Red vertical lines mark the range of values for a YSO to be classified as a Class II source (−1.6 ≤ α′< − 0.3).
Current usage metrics show cumulative count of Article Views (full-text article views including HTML views, PDF and ePub downloads, according to the available data) and Abstracts Views on Vision4Press platform.
Data correspond to usage on the plateform after 2015. The current usage metrics is available 48-96 hours after online publication and is updated daily on week days.
Initial download of the metrics may take a while.