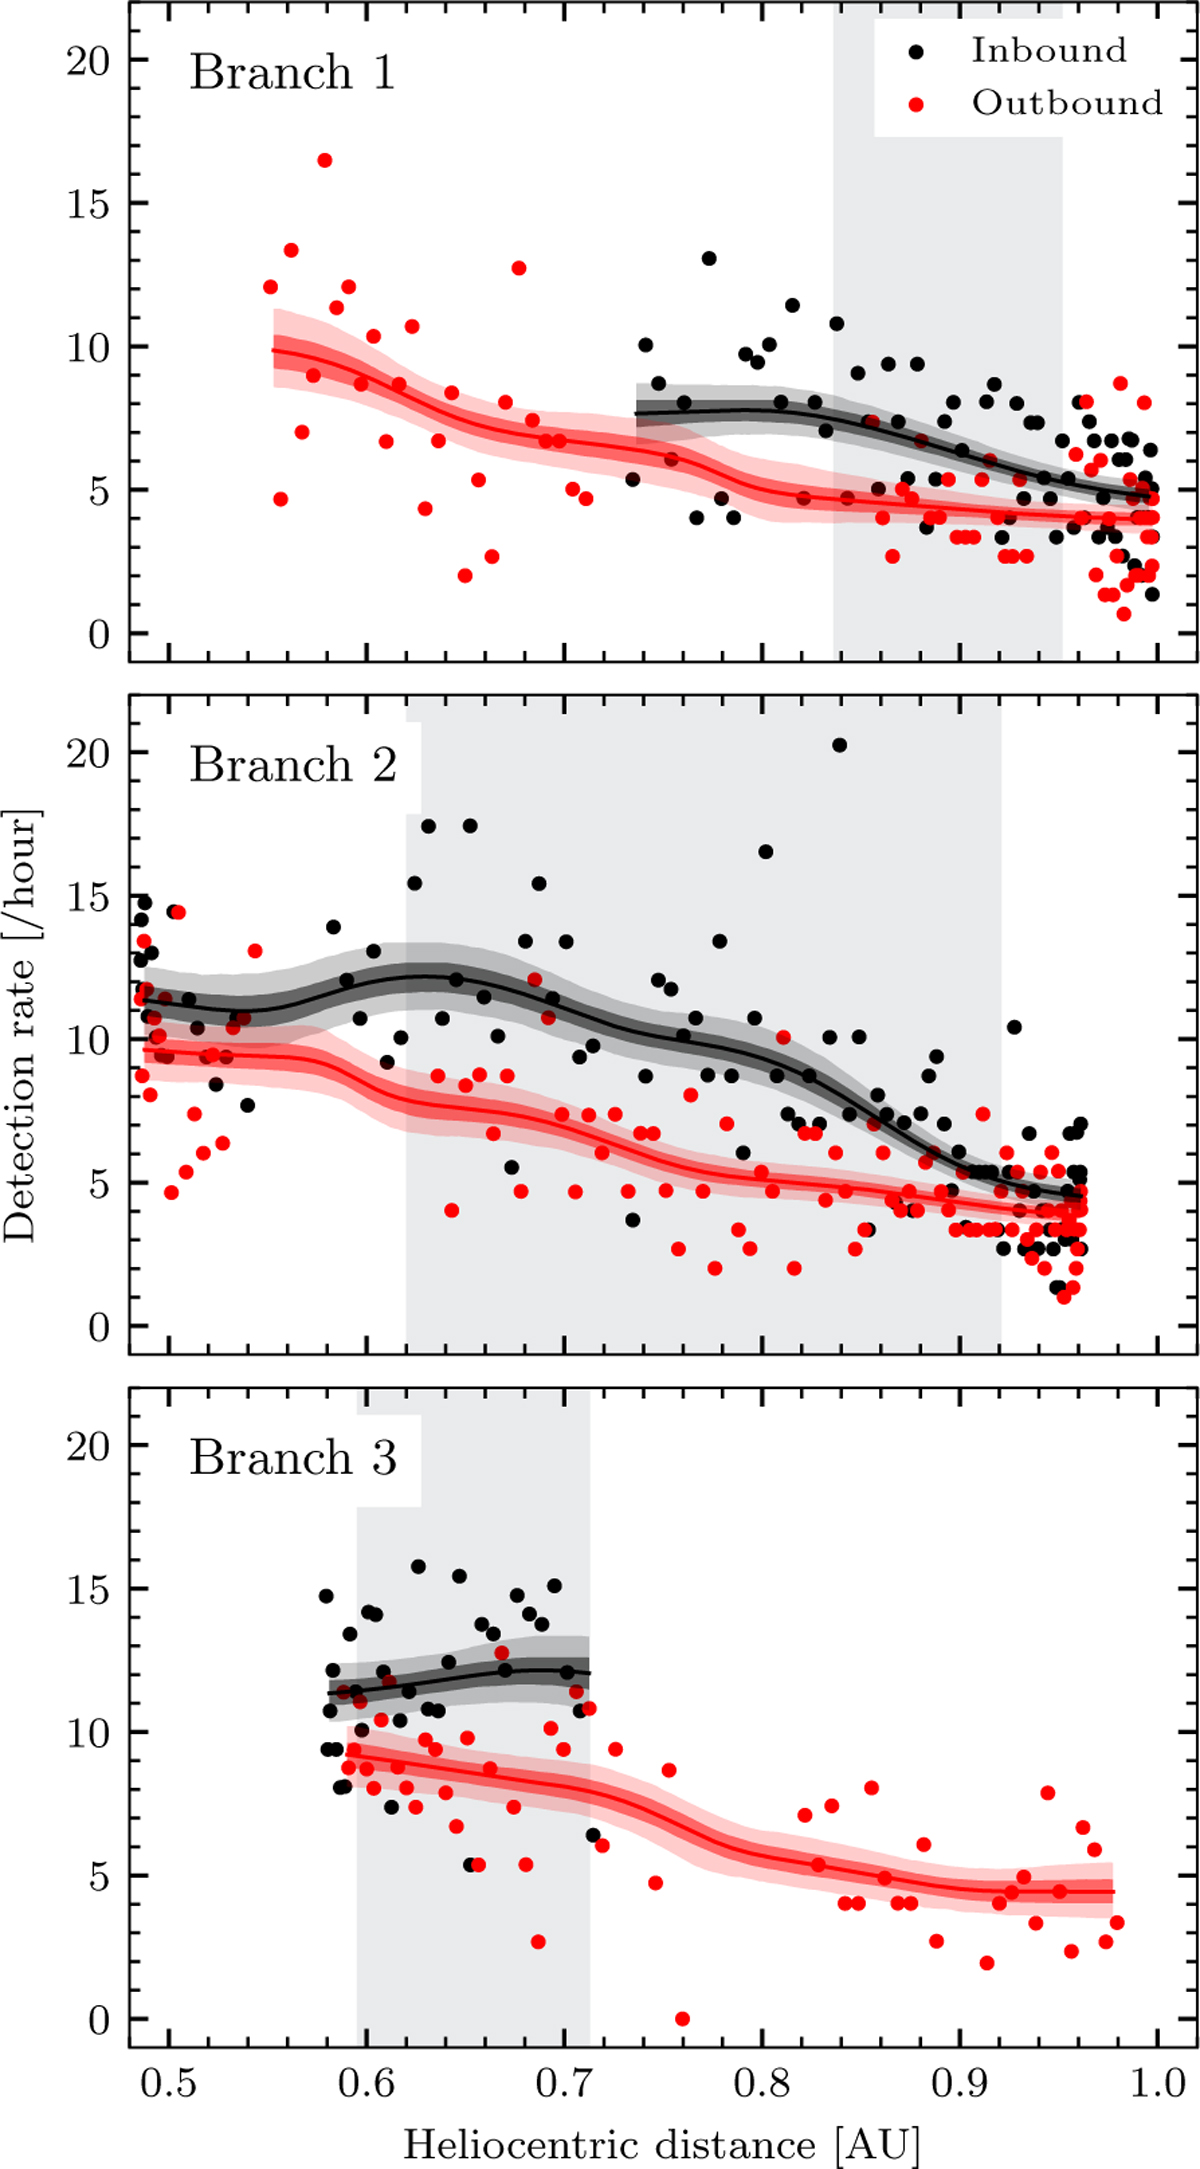
Fig. 4
Download original image
Nonparametric fitting of the detection rate observed between 29 June 2020 and 27 November 2021 in th inbound and outbound part of the trajectory, with branches being separated by gravity assists on 26 December 2020 and 8 August 2021. The lines are the results of non parametric fitting and only grayed intervals are used for further analysis; readers can compare this with Fig. 3.
Current usage metrics show cumulative count of Article Views (full-text article views including HTML views, PDF and ePub downloads, according to the available data) and Abstracts Views on Vision4Press platform.
Data correspond to usage on the plateform after 2015. The current usage metrics is available 48-96 hours after online publication and is updated daily on week days.
Initial download of the metrics may take a while.