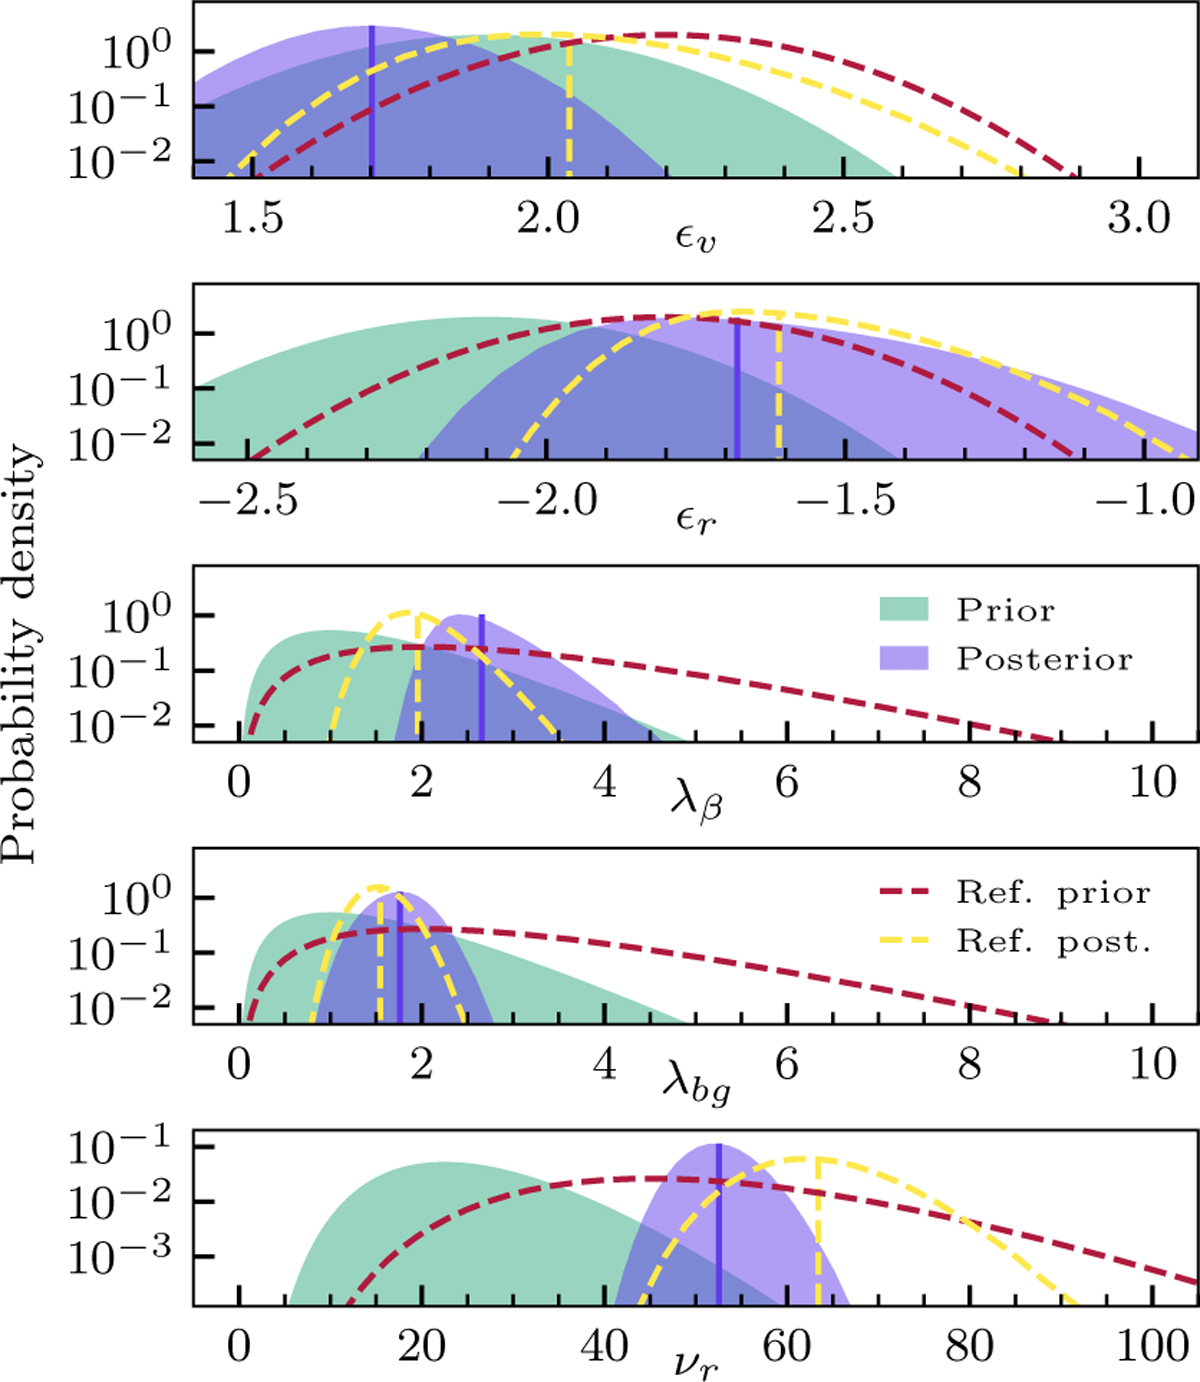
Fig. I.2
Download original image
Prior and posterior distributions of parameters, with priors shifted toward lower values. The priors and posteriors from Fig. 8 are shown with dashed lines for comparison.
Current usage metrics show cumulative count of Article Views (full-text article views including HTML views, PDF and ePub downloads, according to the available data) and Abstracts Views on Vision4Press platform.
Data correspond to usage on the plateform after 2015. The current usage metrics is available 48-96 hours after online publication and is updated daily on week days.
Initial download of the metrics may take a while.