Open Access
Fig. C.3.
Download original image
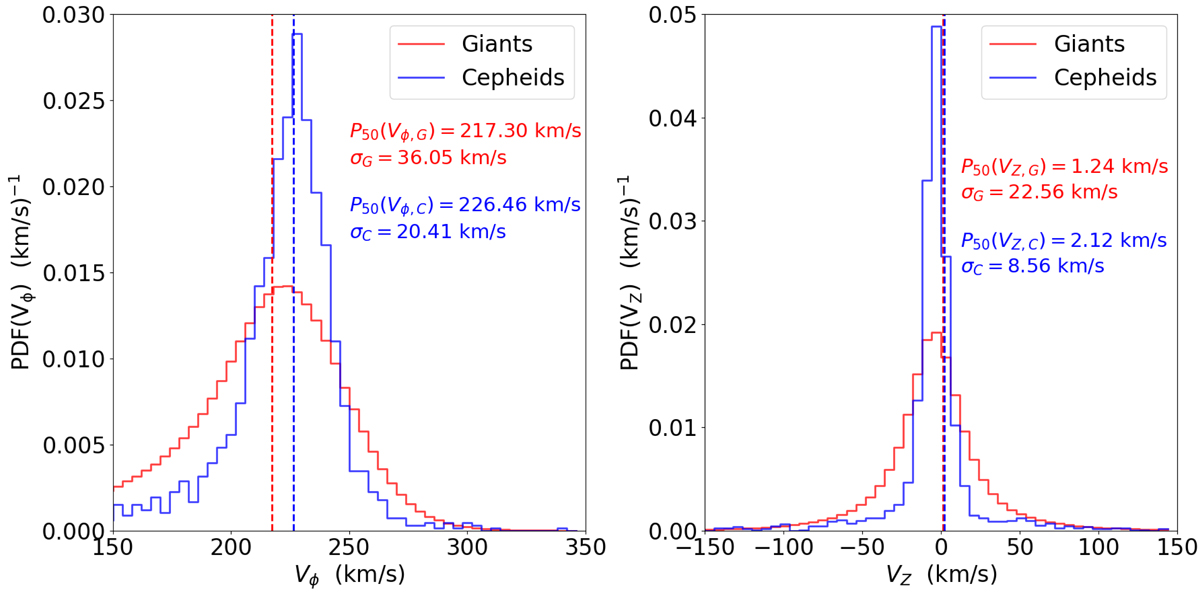
Probability distribution function of the azimuthal (left panel) and vertical (right panel) velocities for the subsample of giant stars (red bars) and Cepheids (blue bars). The median values (P50) and median absolute deviations (σ) for both samples are indicated in the inset. Vertical dashed lines denote median values.
Current usage metrics show cumulative count of Article Views (full-text article views including HTML views, PDF and ePub downloads, according to the available data) and Abstracts Views on Vision4Press platform.
Data correspond to usage on the plateform after 2015. The current usage metrics is available 48-96 hours after online publication and is updated daily on week days.
Initial download of the metrics may take a while.