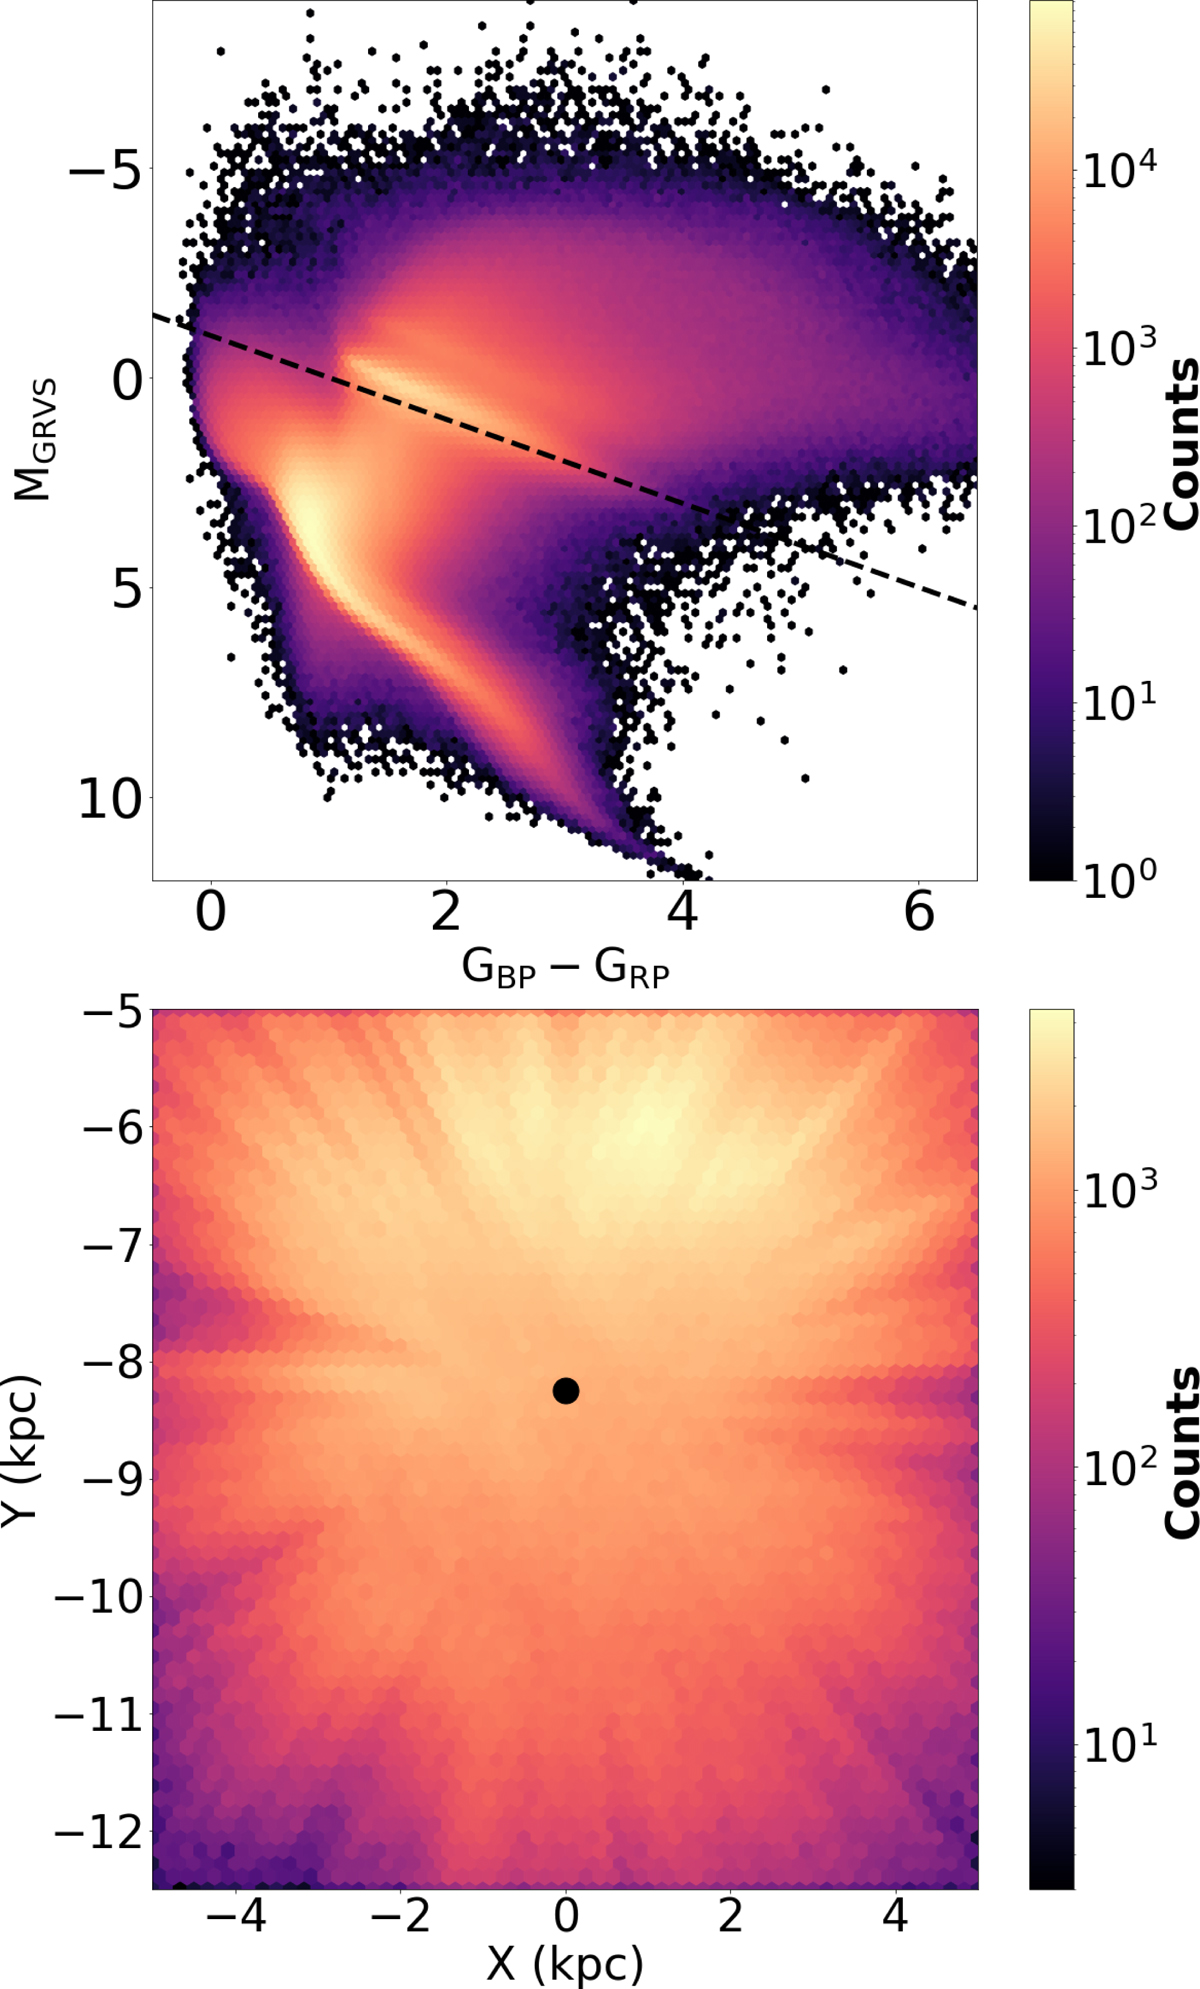
Fig. C.1.
Download original image
Distribution of stars in the Hertzsprung–Russell diagram for the Galactic disc sample (|Zmax|< 0.5 kpc) shown in the upper panel. The dashed black line represents the boundary condition considered to separate Main Sequence and RGB stars (Eq. C.1) neglecting extinction. Density map of the giant sample in the (X, Y) plane in the bottom panel. The solar position is denoted by a solid black circle.
Current usage metrics show cumulative count of Article Views (full-text article views including HTML views, PDF and ePub downloads, according to the available data) and Abstracts Views on Vision4Press platform.
Data correspond to usage on the plateform after 2015. The current usage metrics is available 48-96 hours after online publication and is updated daily on week days.
Initial download of the metrics may take a while.