Fig. 5.
Download original image
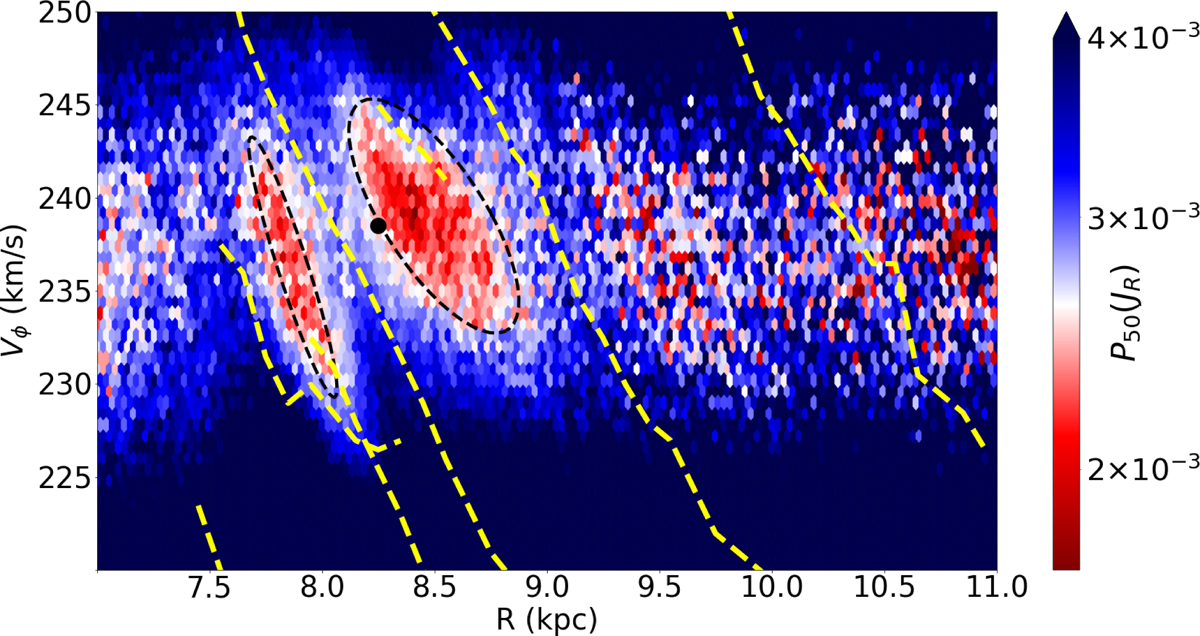
Azimuthal velocity Vϕ vs. R diagram colorcoded with the median JR. The colorbar has been intentionally set in logarithmic scale to cover a wide range of values in JR. The moving groups (dashed yellow lines) are displayed from the bottom left to the upper right corner as follows: Hercules, Dehnen98-6, Horn-Dehnen98, Hyades, Coma Berenices, Sirius, and Arch1-Hat. Black ellipses enclose the two selected areas (see the text), while the Sun is denoted by the solid black circle.
Current usage metrics show cumulative count of Article Views (full-text article views including HTML views, PDF and ePub downloads, according to the available data) and Abstracts Views on Vision4Press platform.
Data correspond to usage on the plateform after 2015. The current usage metrics is available 48-96 hours after online publication and is updated daily on week days.
Initial download of the metrics may take a while.