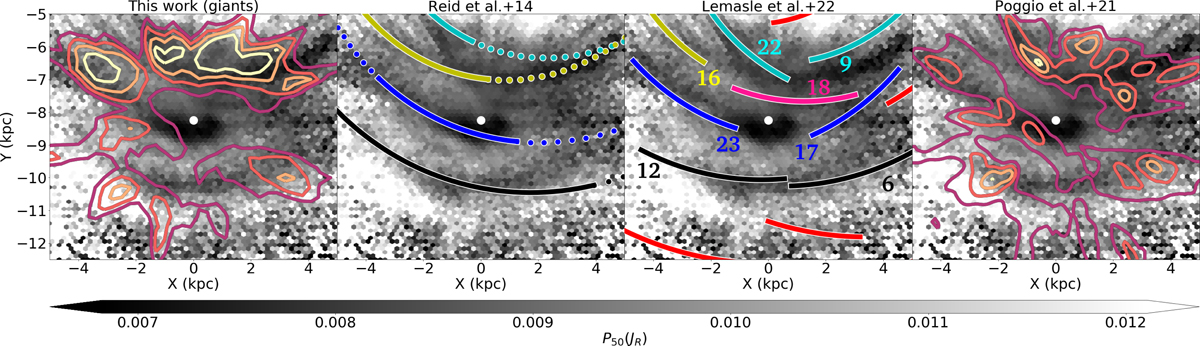
Fig. 4.
Download original image
Comparison of the maps of P50(JR) with the spiral arms reported in literature. First panel: contour lines enclose the overdensities found in the subsample of giants. Second panel: solid lines represent the Scutum (cyan), Sagittarius (yellow), Local (blue), and Perseus (black) spiral arms of Reid et al. (2014), while the dotted lines correspond to their extrapolation in azimuth. Third panel: Solid lines represent the segments of spiral arms of Lemasle et al. (2022), in which their same naming convention is used, while the colorcode results from a visual comparison with these of Reid et al. (2014). The additional structures are indicated by red and pink lines for description convenience. Fourth panel: contour lines illustrate the overdensities reported by Poggio et al. (2021). Background image: reproduction of Fig. 1 using a grey color-scale to increase the contrast between the coloured lines and the background map. The solid white circle denotes the solar position.
Current usage metrics show cumulative count of Article Views (full-text article views including HTML views, PDF and ePub downloads, according to the available data) and Abstracts Views on Vision4Press platform.
Data correspond to usage on the plateform after 2015. The current usage metrics is available 48-96 hours after online publication and is updated daily on week days.
Initial download of the metrics may take a while.