Fig. 1

Download original image
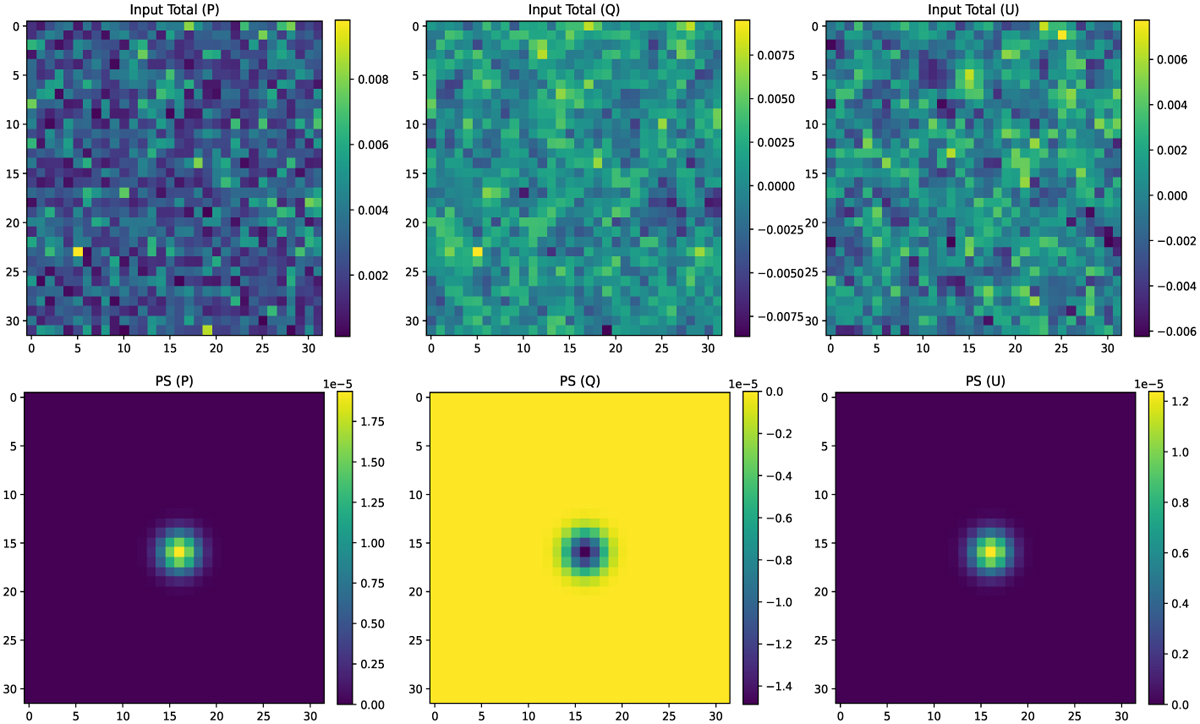
Example of one simulation used to train or validate POSPEN for P, Q, and U polarisation maps (left, middle, and right columns, respectively). Top panels show the input patch formed by all the emissions, where the network learns how to extract the polarisation of the PS. Bottom figures show an example of the simulated PS, where we use the integrated intensity as a label for the training. The units are in Jy.
Current usage metrics show cumulative count of Article Views (full-text article views including HTML views, PDF and ePub downloads, according to the available data) and Abstracts Views on Vision4Press platform.
Data correspond to usage on the plateform after 2015. The current usage metrics is available 48-96 hours after online publication and is updated daily on week days.
Initial download of the metrics may take a while.


