Fig. 8.
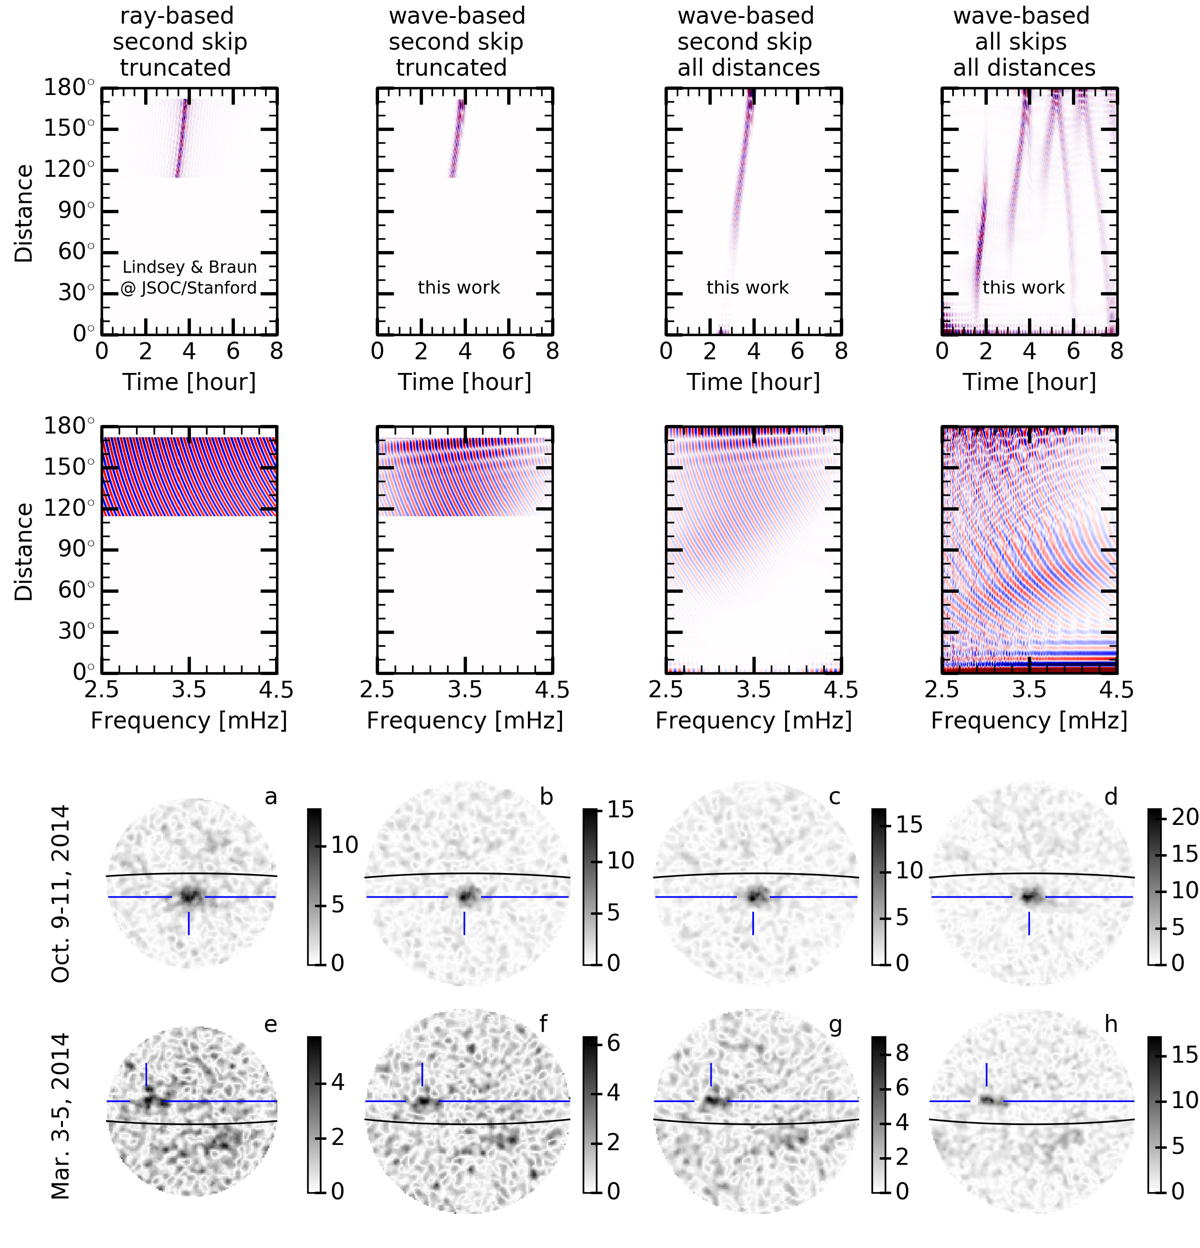
Download original image
Green’s functions and associated S/Ns of the phase maps of the far side. Top row: Green’s functions in the time–distance domain. Second row: imaginary part of Green’s functions in the frequency–distance domain. Third row: S/N for active region NOAA 12192 averaged over October 9–11, 2014. Last row: S/Ns for active region NOAA 12007 averaged over March 3–5, 2014. Panels a,e: maps using the ray-based Green’s function from the JSOC/Stanford pipeline, for focus points within 50° of the far-side disk center. Panels b,f: maps using the wave-based Green’s function restricted to the second-skip and separation distances 115°−172°. The map covers 60° within the far-side disk center. Panels c,g: same as panels b and f, but without truncating the Green’s function in separation distance. Panels d,h: same as panels c and g, but using all branches of the wave-based Green’s function, which is the approach used in the present paper. In panels a–h, the black solid lines mark the equator. The blue lines indicate locations of active regions NOAA 12192 (third row) and NOAA 12007 (last row).
Current usage metrics show cumulative count of Article Views (full-text article views including HTML views, PDF and ePub downloads, according to the available data) and Abstracts Views on Vision4Press platform.
Data correspond to usage on the plateform after 2015. The current usage metrics is available 48-96 hours after online publication and is updated daily on week days.
Initial download of the metrics may take a while.