Fig. 7.
Download original image
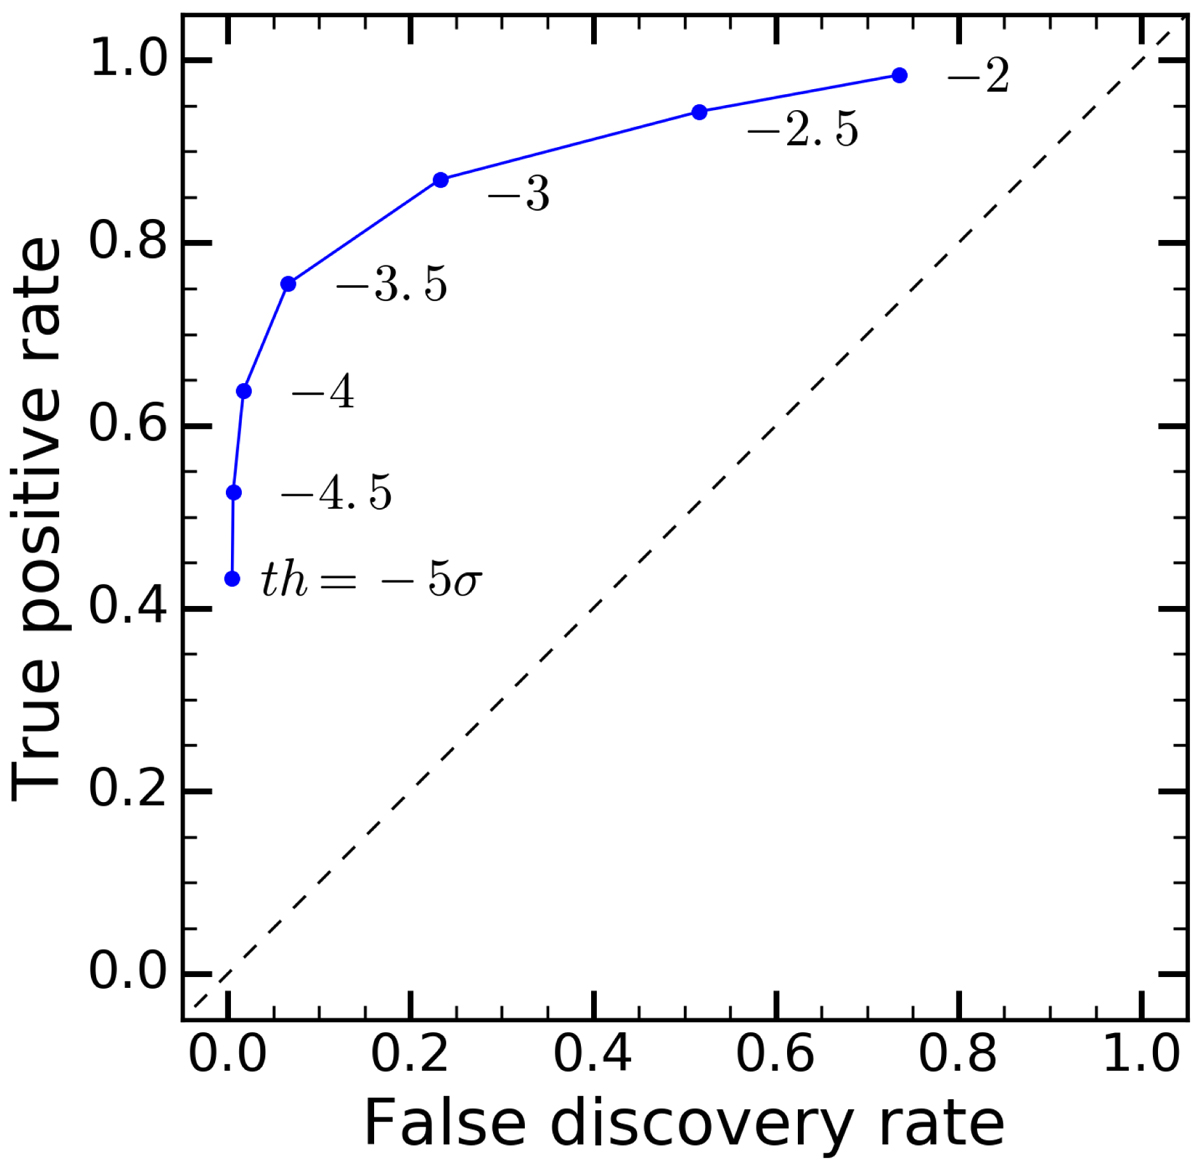
ROC analysis: True positive rate versus false discovery rate for different thresholds in Φ (th). Our improved far-side maps (three-day averages) are used and the minimum active-region area is fixed at Smin = 1000 μhs. Random detections would fall on the black dashed line. For all thresholds th, the outcome is clearly above this diagonal. The optimal threshold, th = −3.5σ, corresponds to the point that is farthest from the diagonal. It is reported as a horizontal dashed line in Fig. 4b.
Current usage metrics show cumulative count of Article Views (full-text article views including HTML views, PDF and ePub downloads, according to the available data) and Abstracts Views on Vision4Press platform.
Data correspond to usage on the plateform after 2015. The current usage metrics is available 48-96 hours after online publication and is updated daily on week days.
Initial download of the metrics may take a while.