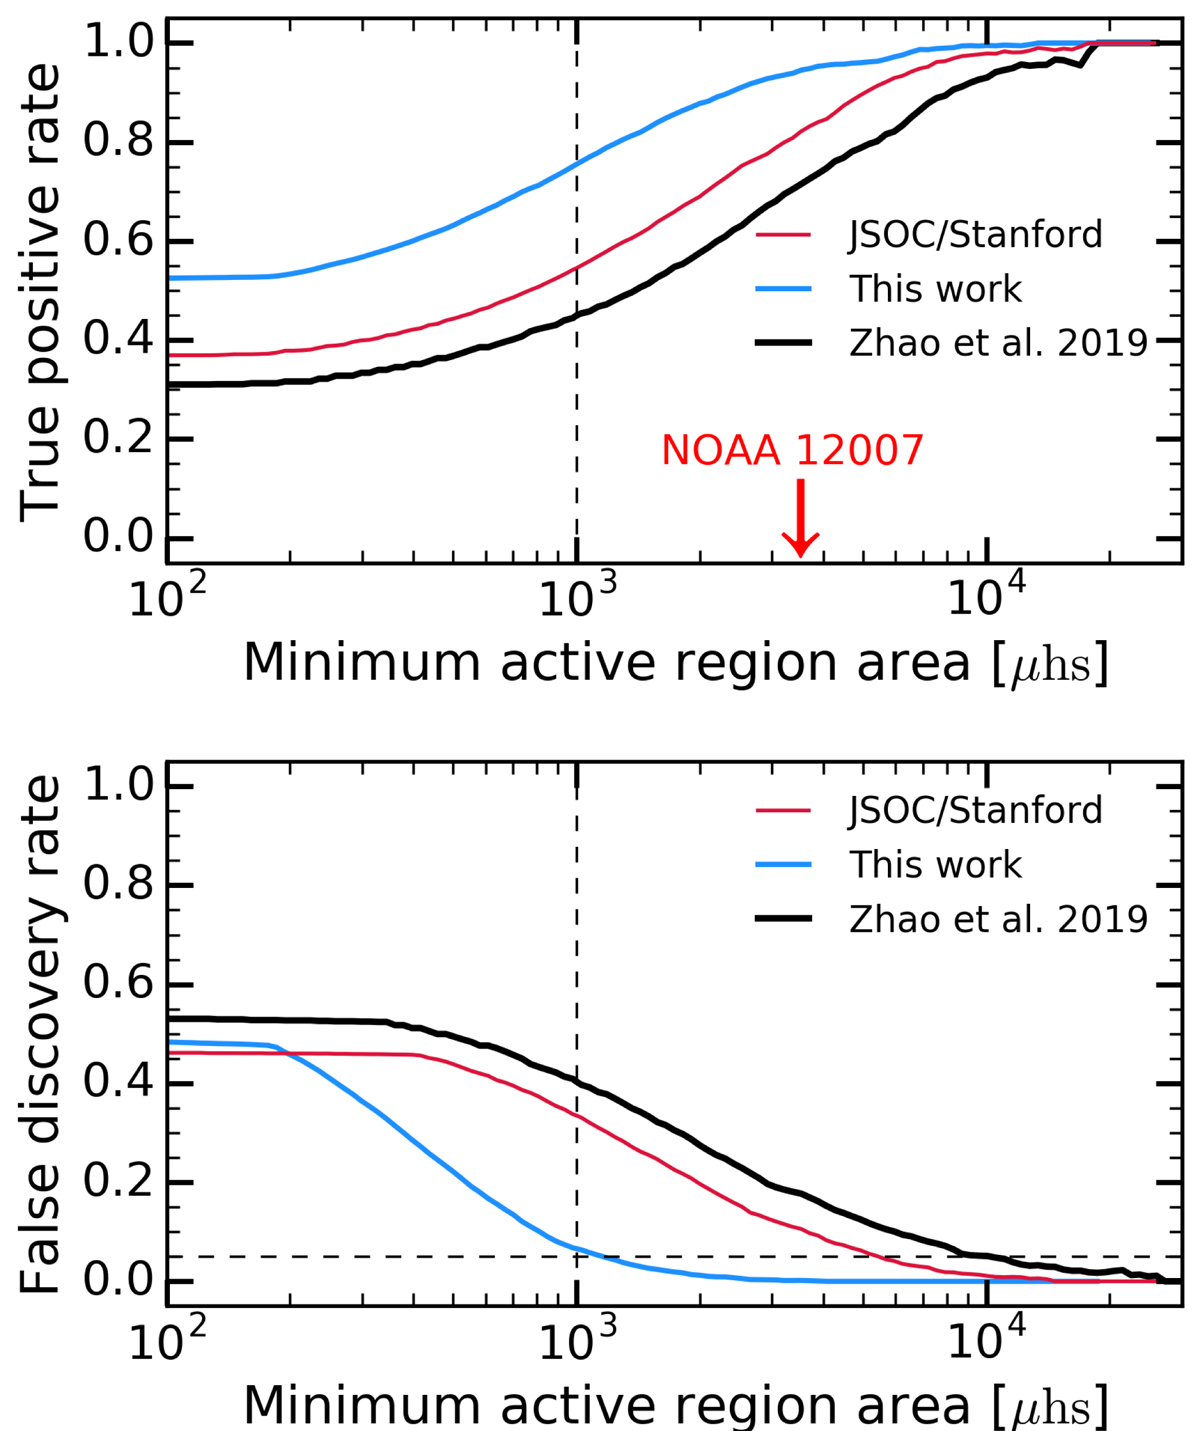
Fig. 6.
Download original image
Active-region detection statistics on the far side. The seismic maps from this work (three-day averages), the JSOC/Stanford seismic holography “strong region maps” (five-day averages), and the maps from time–distance helioseismology (Zhao et al. 2019, four-day averages) are compared with STEREO maps (four-day averages). Top panel: true-positive detection rates for the three seismic imaging methods as a function of minimum active region area Smin. The area of NOAA 12007 is S = 3.4 × 10³ μhs (red arrow and Fig. 2b). Bottom panel: false-discovery rates. The horizontal dashed line is drawn at 5%. Our improved method has a significantly smaller false-discovery rate than the other methods, in the Smin range of interest.
Current usage metrics show cumulative count of Article Views (full-text article views including HTML views, PDF and ePub downloads, according to the available data) and Abstracts Views on Vision4Press platform.
Data correspond to usage on the plateform after 2015. The current usage metrics is available 48-96 hours after online publication and is updated daily on week days.
Initial download of the metrics may take a while.