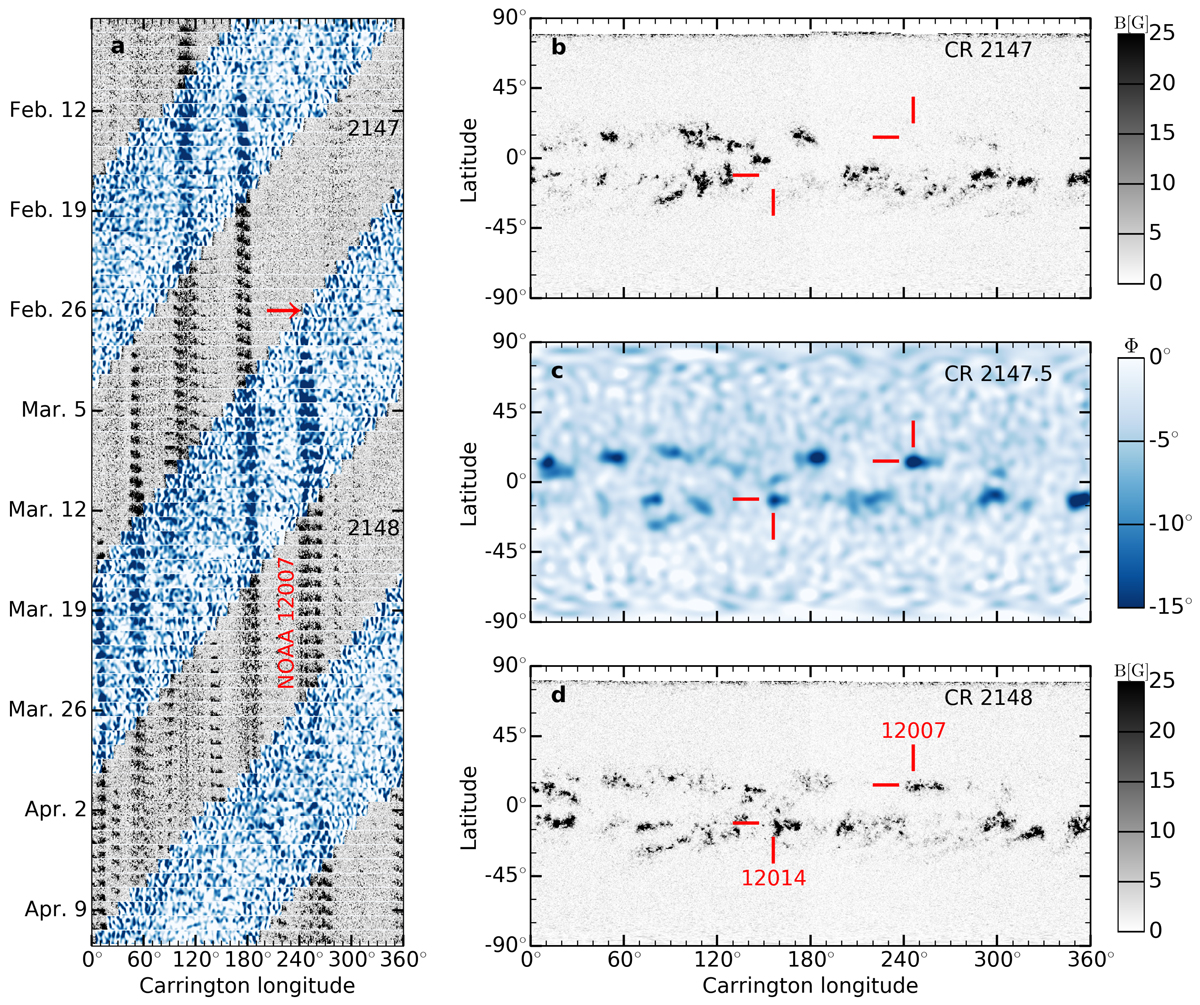
Fig. 5.
Download original image
Emergence of active regions on the far side. Panel a: longitude–time diagram extracted from the daily composite maps of Fig. 2a. Narrow bands in latitude (10° < λ < 20°) are stacked together to show the evolution of individual active regions. The blue shades correspond to the far side (daily seismic phase), and the gray shades to the near side (magnetograms, from CR 2147 to CR 2148). The red arrow indicates the time when active region NOAA 12007 emerges near the limb on the far side. Panels b–d: Carrington synoptic maps constructed by averaging the magnetograms on the near side (CR 2147 and 2148) and the seismic phase on the far side (CR 2147.5). At any spatial location, the data are averaged over 14 days in these Carrington maps. The red lines point to two particular active regions, NOAA 12007 and 12014, which are not visible in CR 2147 but visible in CR 2147.5 and 2148.
Current usage metrics show cumulative count of Article Views (full-text article views including HTML views, PDF and ePub downloads, according to the available data) and Abstracts Views on Vision4Press platform.
Data correspond to usage on the plateform after 2015. The current usage metrics is available 48-96 hours after online publication and is updated daily on week days.
Initial download of the metrics may take a while.