Fig. 4.
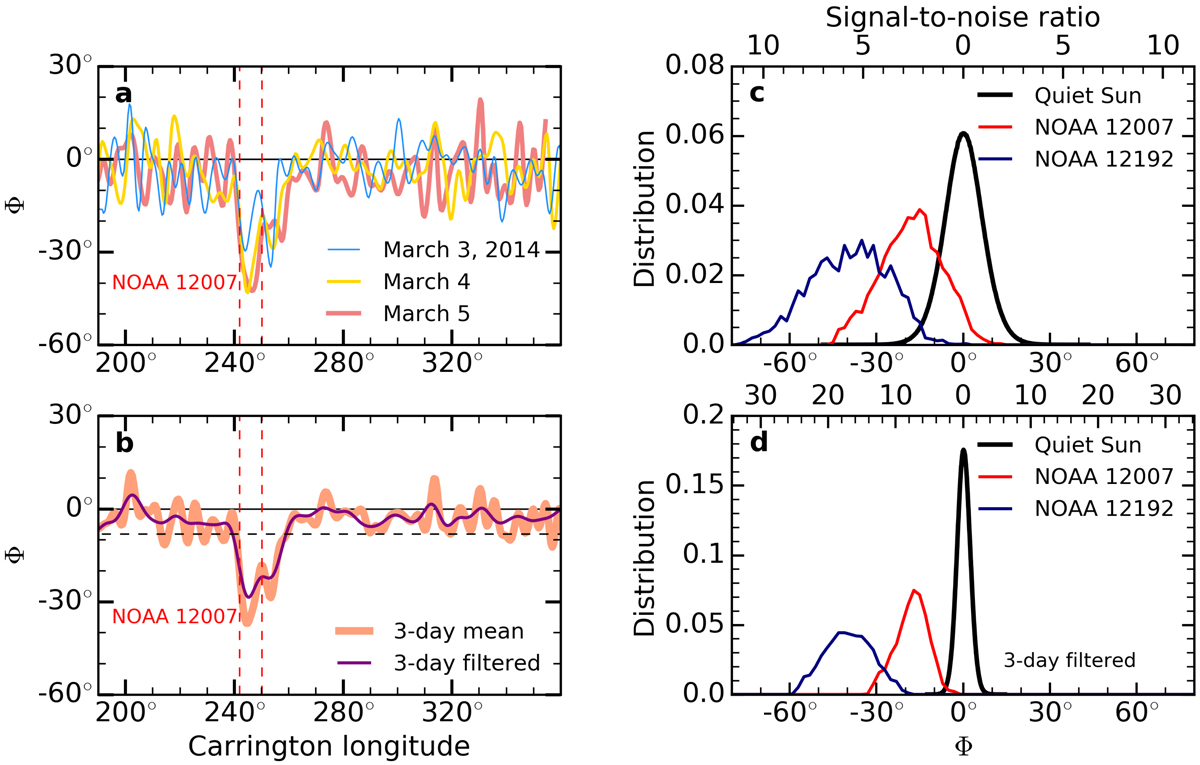
Download original image
Detection of active regions on the far side with helioseismic holography. Panel a: cuts through the phase maps of March 2014 at the latitude of active region NOAA 12007 (λ = 13.5°, see red horizontal lines in Fig. 2). The three curves correspond to March 3, 4, and 5. Panel b: the thick orange curve shows the phase when applying holography to three days at once (March 3–5). The purple curve is obtained after applying a spatial low-pass filter (l < 40). Panel c: the red curve shows the normalized distribution of the daily values of Φ in a disk of diameter 8° (∼100 Mm) centered on AR NOAA 12007 (see vertical dashed lines in panel a). In total, 14 days of data are used to track the region across the far side. The blue curve is the distribution for the very large region NOAA 12192 on October 2014 (see Fig. 3), constructed in the same way as for NOAA 12007. The black curve is the distribution of daily values in the quiet Sun, from which we measure the standard deviation of the noise, σ = 6.9°. Panel d: same as panel c, but the distributions are constructed from three-day spatially filtered maps of Φ, hence the smaller noise level σ = 2.3°. The threshold th = −3.5σ is plotted as a horizontal dashed line in panel b. We see that NOAA 12007 corresponds to a signal that is far beyond this threshold, with S/N ∼ 7. The very large active region NOAA 12192 is detected with a confidence level of nearly 100% (S/N ∼ 17).
Current usage metrics show cumulative count of Article Views (full-text article views including HTML views, PDF and ePub downloads, according to the available data) and Abstracts Views on Vision4Press platform.
Data correspond to usage on the plateform after 2015. The current usage metrics is available 48-96 hours after online publication and is updated daily on week days.
Initial download of the metrics may take a while.