Fig. 2.
Download original image
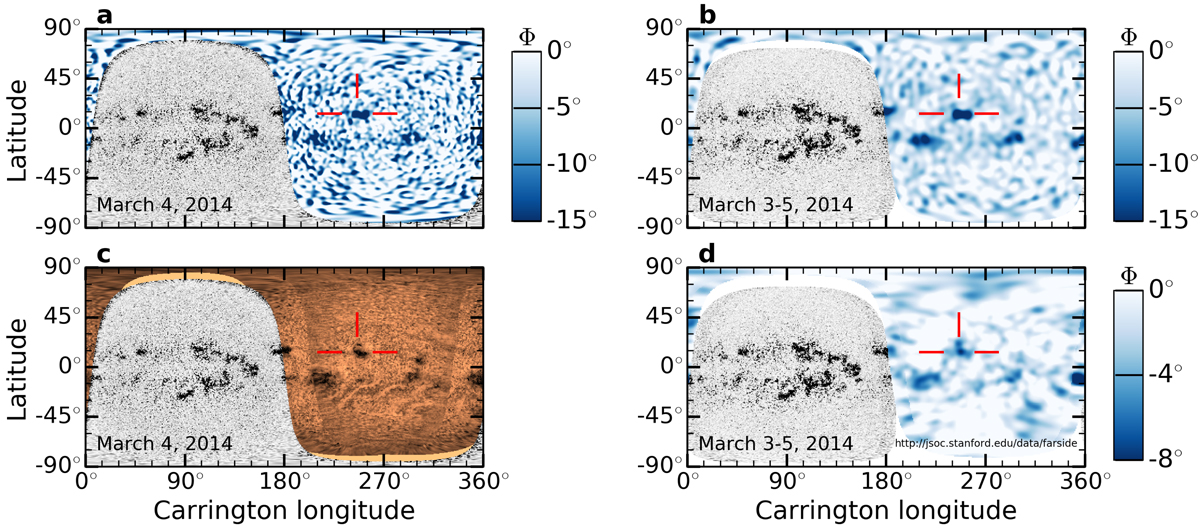
Composite maps of the solar surface in the Carrington frame. In all panels, the near side (gray shades) shows the SDO/HMI unsigned line-of-sight magnetic field at 0:00 TAI on March 4, 2014. Panel a: far-side map using improved helioseismic holography (Φ, blue shades) applied to 31 h of SDO/HMI Dopplergrams centered on March 4, 2014. The red lines indicate the location of active region NOAA 12007 when it emerges ∼8 days later on the near side. The longitude is that of Carrington rotation 2147. Panel b: same as panel a but for a three-day average over March 3–5. A low pass spatial filter (l < 40) was applied. Panel c: far side seen by STEREO/EUVI at 304 Å. Panel d: far-side map from the standard JSOC/Stanford helioseismic pipeline (blue shades) using 3 days of data.
Current usage metrics show cumulative count of Article Views (full-text article views including HTML views, PDF and ePub downloads, according to the available data) and Abstracts Views on Vision4Press platform.
Data correspond to usage on the plateform after 2015. The current usage metrics is available 48-96 hours after online publication and is updated daily on week days.
Initial download of the metrics may take a while.