Open Access
Fig. A.5.
Download original image
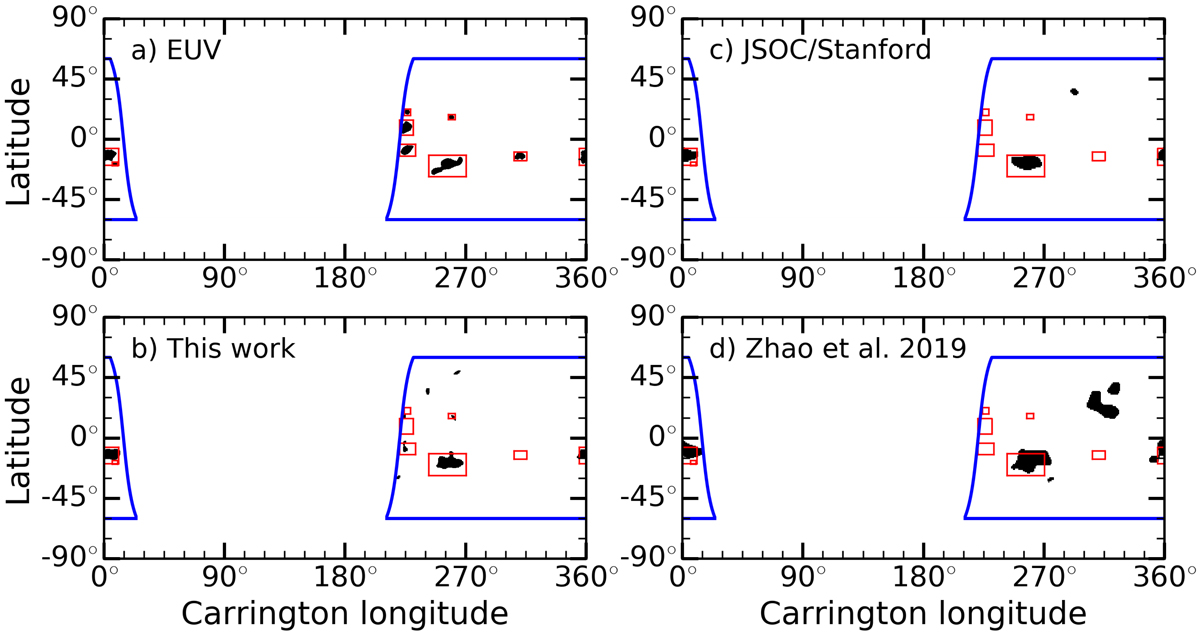
Detected active regions in each of the four panels of Fig. A.4 (black regions). For reference, the red boxes are copied from Fig. A.4a (EUV map). Latitudes above 60° are ignored (cf. blue contours). Such data are used to generate the true positive detection rates and the false-discovery rates discussed in Sect. 4.5.
Current usage metrics show cumulative count of Article Views (full-text article views including HTML views, PDF and ePub downloads, according to the available data) and Abstracts Views on Vision4Press platform.
Data correspond to usage on the plateform after 2015. The current usage metrics is available 48-96 hours after online publication and is updated daily on week days.
Initial download of the metrics may take a while.