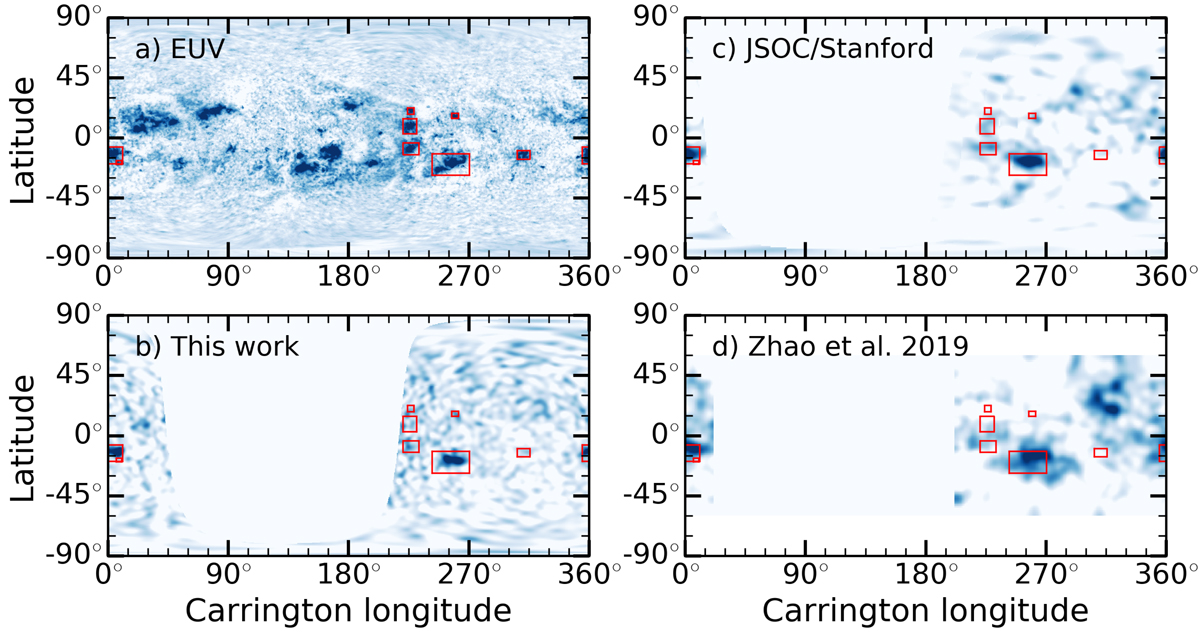
Fig. A.4.
Download original image
Detections of far-side active regions on October 15, 2013 (12:00 TAI). Panel (a): Composite EUV maps at 304 Åfrom Liewer et al. (2017; four-day averages). The detected active regions are enclosed in the red boxes. Panel (b): Seismic far-side images from this work (three-day averages). For reference, the red boxes are copied from panel (a). Panel (c): Same as panel b but for holographic far-side maps from JSOC/Stanford (five-day averages). Panel (d): Same as panel b but for time–distance far-side maps from Zhao et al. (2019; four-day averages).
Current usage metrics show cumulative count of Article Views (full-text article views including HTML views, PDF and ePub downloads, according to the available data) and Abstracts Views on Vision4Press platform.
Data correspond to usage on the plateform after 2015. The current usage metrics is available 48-96 hours after online publication and is updated daily on week days.
Initial download of the metrics may take a while.