Open Access
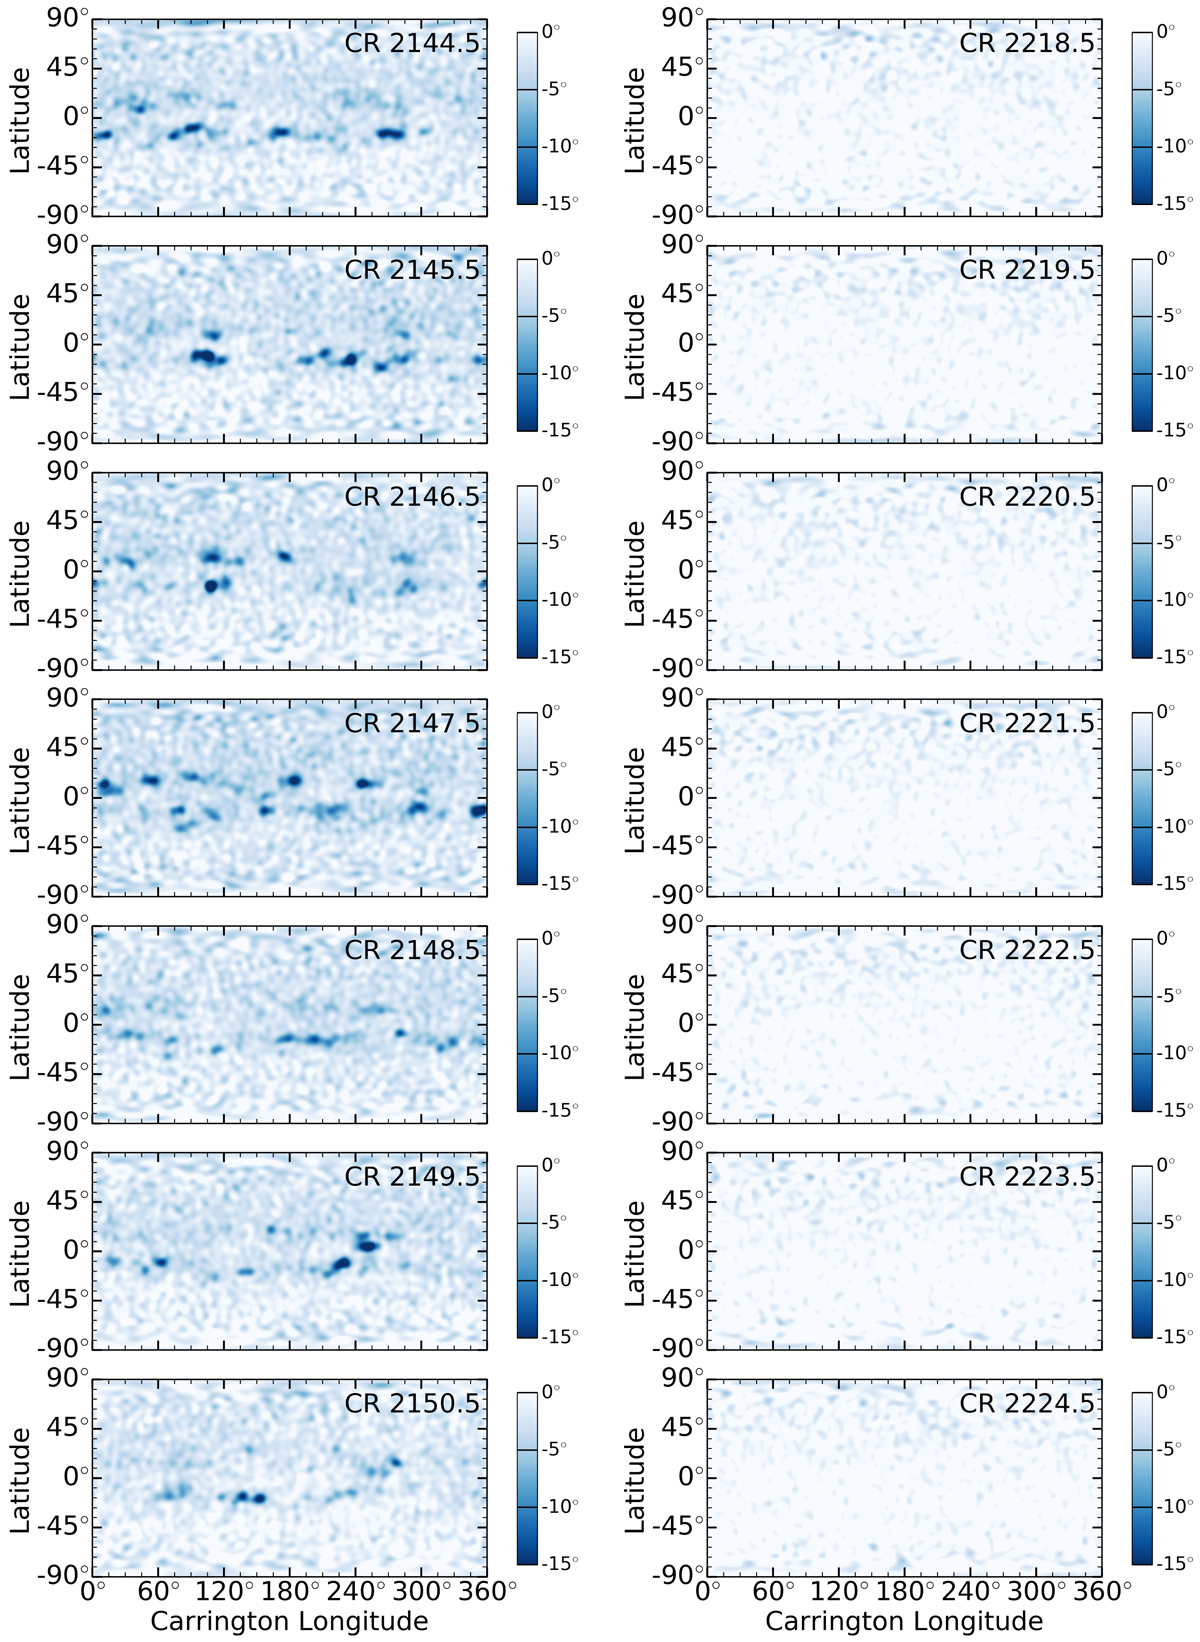
Fig. A.3.
Download original image
Seismic synoptic maps of the far side constructed as in Fig. 4c. Left panels: Carrington rotations 2144.5–2150.5 during the maximum phase of Cycle 24 (2013–2014). Right panels: Carrington rotations 2218.5–2224.5 during solar minimum in 2019. The same color scale is used for all maps.
Current usage metrics show cumulative count of Article Views (full-text article views including HTML views, PDF and ePub downloads, according to the available data) and Abstracts Views on Vision4Press platform.
Data correspond to usage on the plateform after 2015. The current usage metrics is available 48-96 hours after online publication and is updated daily on week days.
Initial download of the metrics may take a while.