Fig. F.2
Download original image
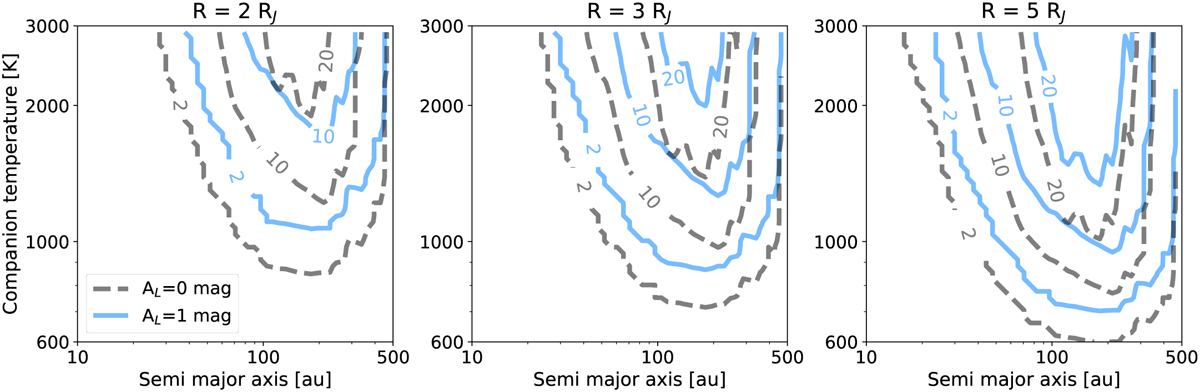
Survey completeness maps obtained considering an additional extinction factor AL′ = 1.0 mag. The three plots represent maps when assuming Rp = 2, 3, 5 RJ (left, middle and right panels, respectively). Solid contours limit the areas with completeness 2, 10 and 20, while dotted lines are reported from Fig. 8 and limit the same detection probability values when no extinction effects are included, thus allowing the direct comparison between the two cases.
Current usage metrics show cumulative count of Article Views (full-text article views including HTML views, PDF and ePub downloads, according to the available data) and Abstracts Views on Vision4Press platform.
Data correspond to usage on the plateform after 2015. The current usage metrics is available 48-96 hours after online publication and is updated daily on week days.
Initial download of the metrics may take a while.