Fig. C.1
Download original image
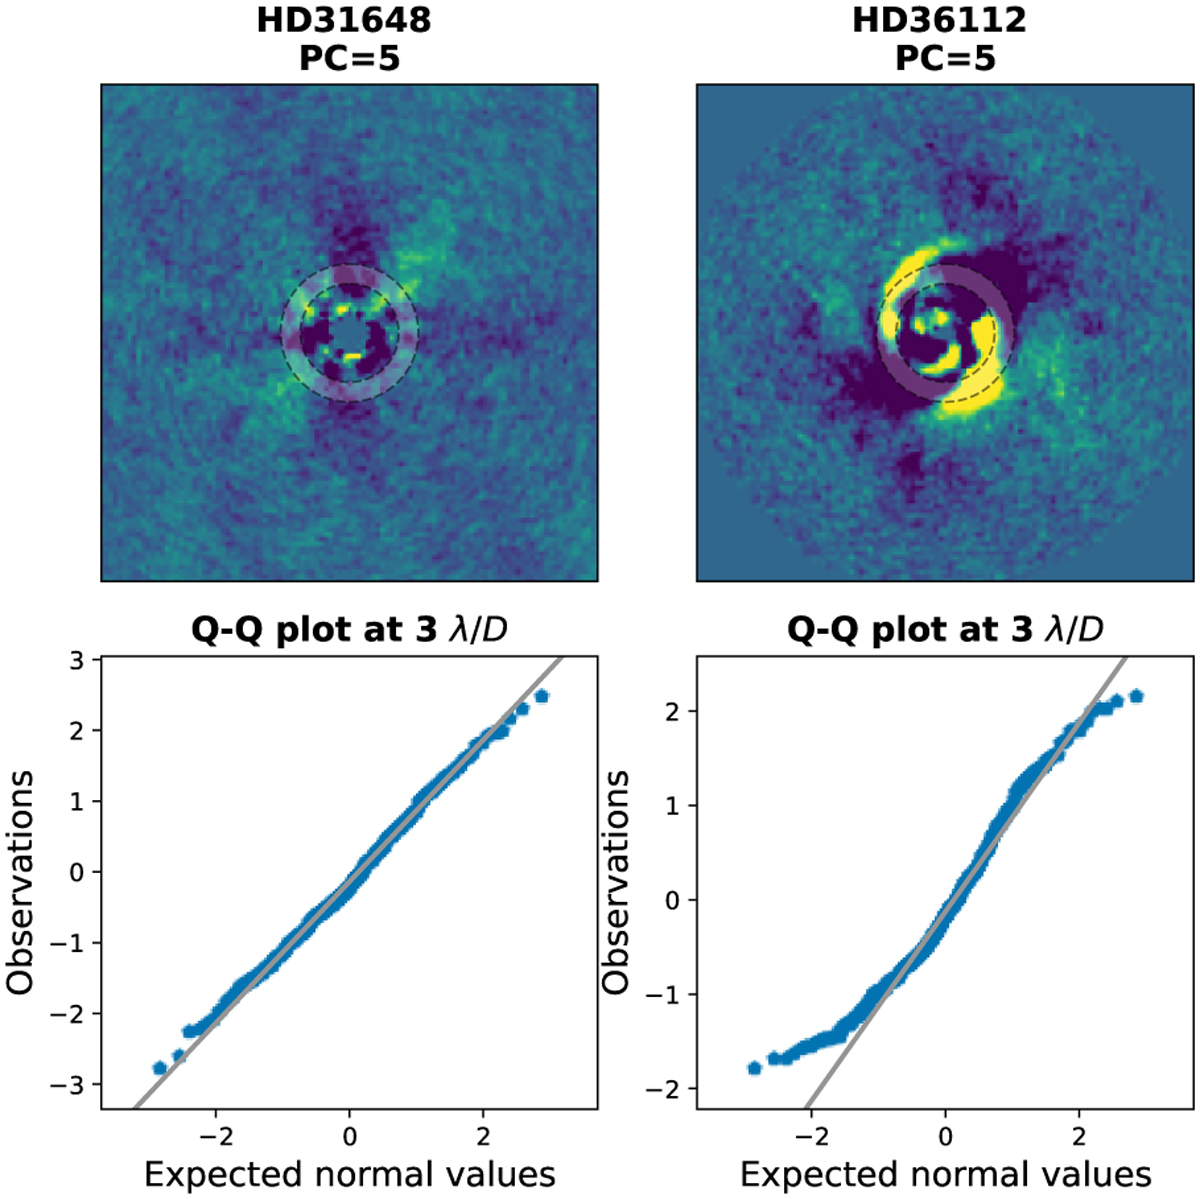
Noise statistics of the NaCo-ISPY data. Top: Residuals for HD31648 and HD36112 (left and right respectively). The ring highlights the location where the noise is investigated in this figure, at 3λ/D. Bottom: Q-Q plots comparing the noise in the data (blue datapoints) with the expectation from Gaussian noise (gray line). In the right panel the light tails due to the presence of the disk signal and consequent negative self-subtraction cause the noise to deviate from a normal distribution.
Current usage metrics show cumulative count of Article Views (full-text article views including HTML views, PDF and ePub downloads, according to the available data) and Abstracts Views on Vision4Press platform.
Data correspond to usage on the plateform after 2015. The current usage metrics is available 48-96 hours after online publication and is updated daily on week days.
Initial download of the metrics may take a while.