Fig. 1
Download original image
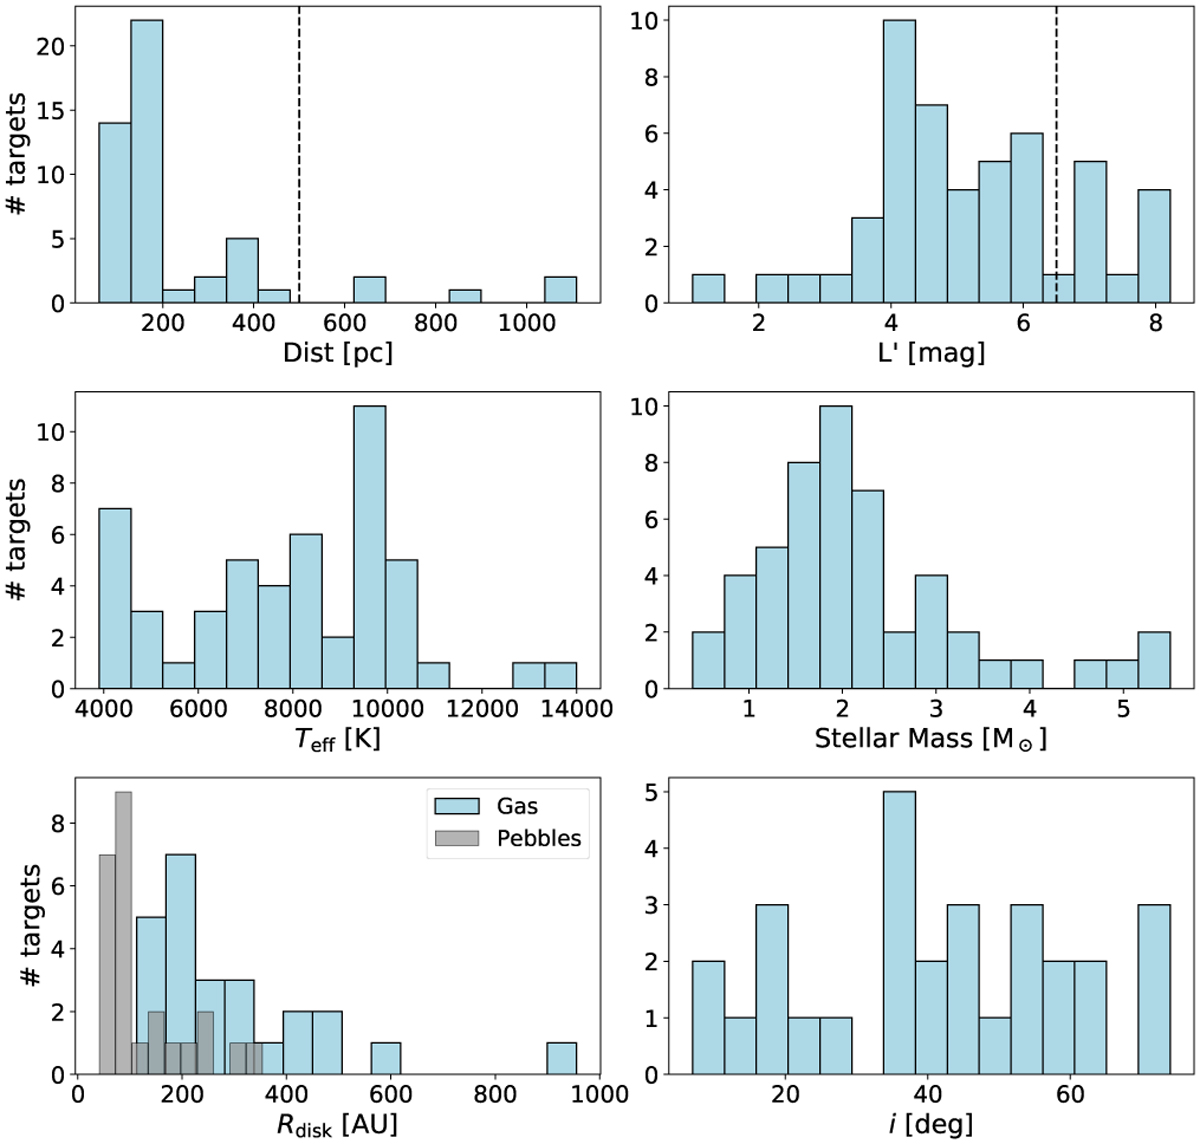
Stellar and disk parameters for the objects in the ISPY PPD sample. In the top row the histogram for the distances (left) and L′ observed magnitudes (right) are reported. Stellar effective temperatures (left) and masses (right) are shown in the middle row. Finally, the bottom row provides the distributions of the disk outer radius (gas and mm-dust) on the left and disk inclinations (whenever measured) on the right. The dashed vertical lines represent the distance cutoff applied in Sect. 2.4 (top left panel) and the limiting brightness for the coronagraphic observations (top right panel), respectively.
Current usage metrics show cumulative count of Article Views (full-text article views including HTML views, PDF and ePub downloads, according to the available data) and Abstracts Views on Vision4Press platform.
Data correspond to usage on the plateform after 2015. The current usage metrics is available 48-96 hours after online publication and is updated daily on week days.
Initial download of the metrics may take a while.