Open Access
Fig. 3.
Download original image
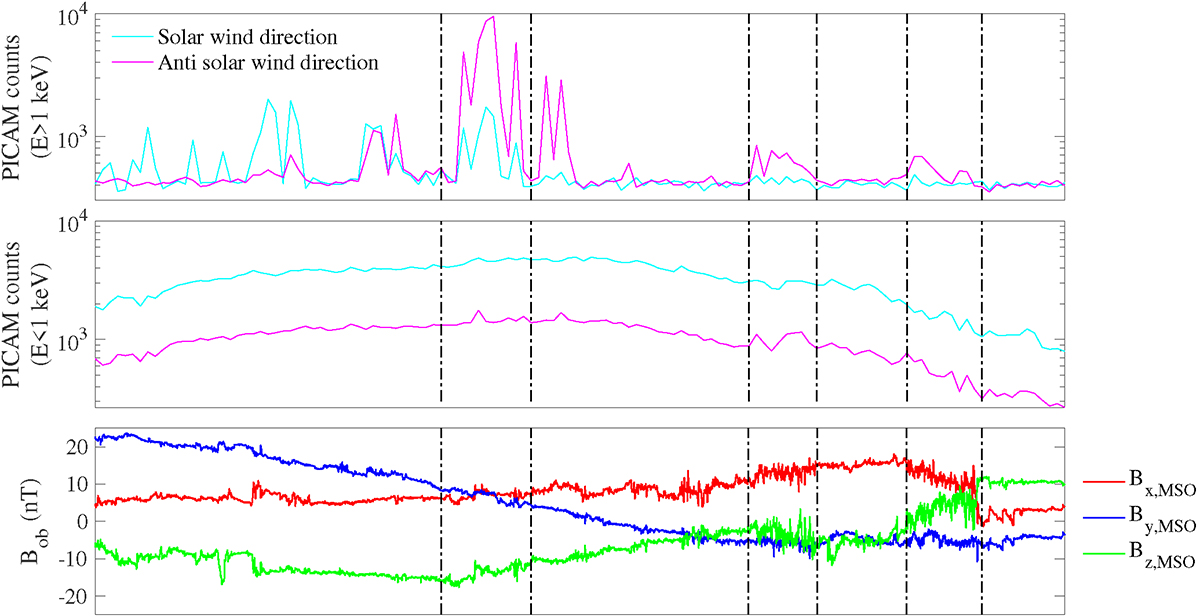
High-energy (> 1 keV, top) and low-energy (< 1 keV, middle) ion counts in the solar wind direction (cyan lines) and in its opposite direction (magenta lines). Bottom: magnetic field measurements. The vertical dashed-dotted lines indicate the time intervals of interest (see Fig. 2).
Current usage metrics show cumulative count of Article Views (full-text article views including HTML views, PDF and ePub downloads, according to the available data) and Abstracts Views on Vision4Press platform.
Data correspond to usage on the plateform after 2015. The current usage metrics is available 48-96 hours after online publication and is updated daily on week days.
Initial download of the metrics may take a while.