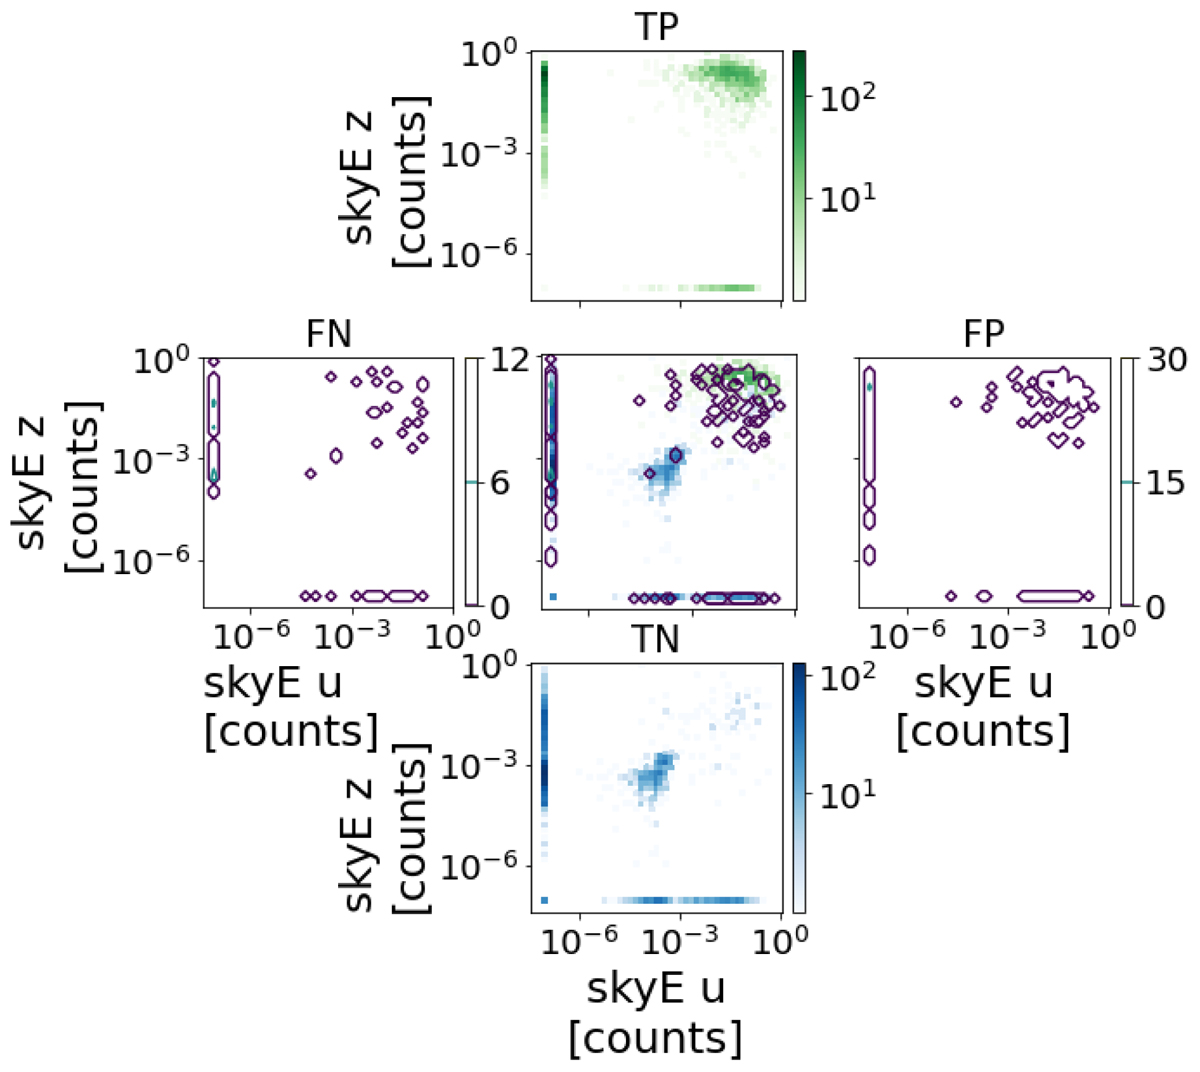
Fig. 8.
Download original image
Distribution of galaxies in the 2D histograms of the TPs (in green, separated above) and TNs (blue, below), and the contour plots of the FNs (left), FPs (right), and of all galaxies (centre) for skyErr in the u-band vs the z-band plane. The 2D histograms show logarithmic colour-bars and the axes are in logarithmic scale. To avoid undefined values for the galaxies with post-normalization features equal to zero, a constant value of 10−7 was added to these. Consequently, they appear as vertical and horizontal lines at the bottom and left sides of each panel. This allows us to see what happens with those. It should be noted that some TNs are in 10−7 for each band, meaning the pre-normalized skyErr in both bands was exactly the same for those galaxies.
Current usage metrics show cumulative count of Article Views (full-text article views including HTML views, PDF and ePub downloads, according to the available data) and Abstracts Views on Vision4Press platform.
Data correspond to usage on the plateform after 2015. The current usage metrics is available 48-96 hours after online publication and is updated daily on week days.
Initial download of the metrics may take a while.