Fig. 3.
Download original image
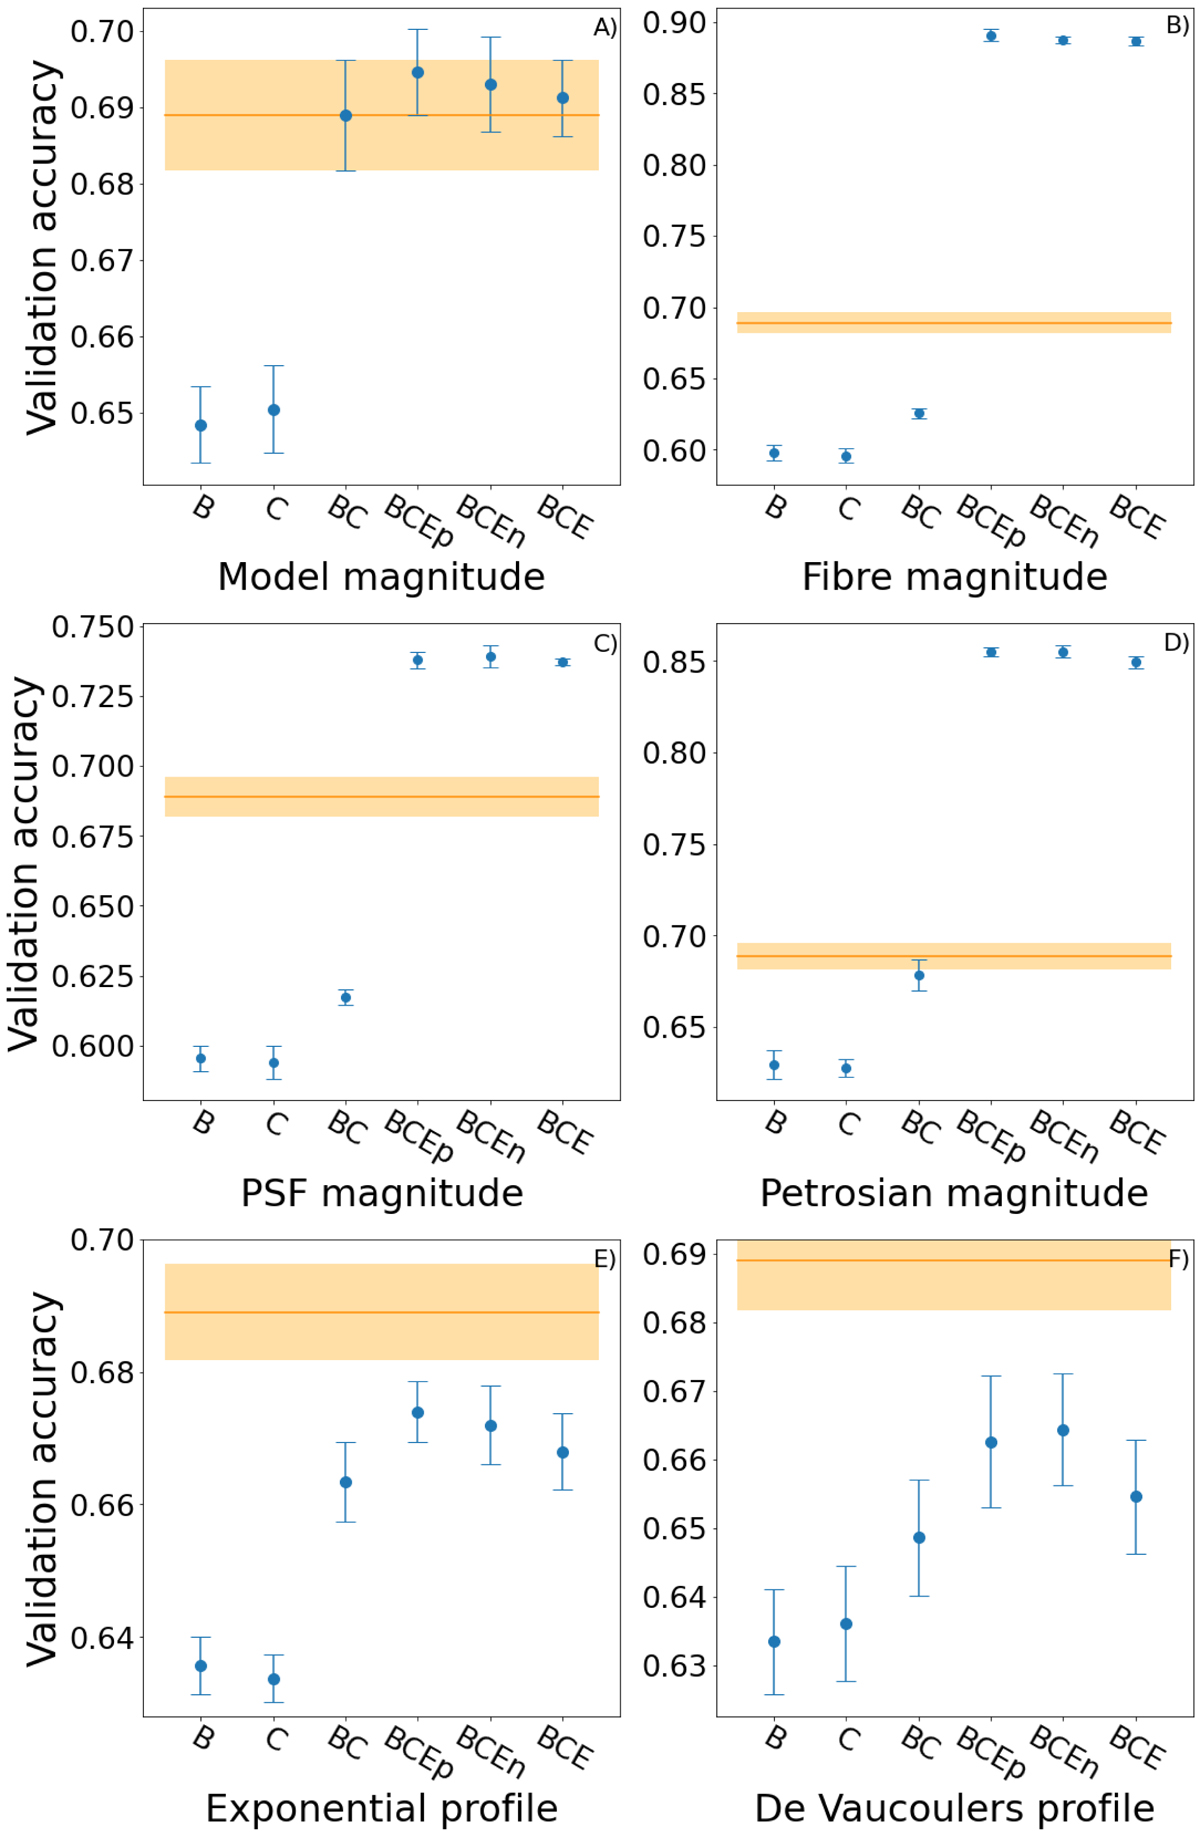
Six-panels plot showing the mean validation peak accuracy of the different input variations for each magnitude type. For each magnitude defined in Sect. 2, we provide several variations: B, which corresponds to the five band values; C, the ten colours obtained from the five bands; BC, a 15-dimensional space combining bands and colours; and BCE, a 20-dimensional space that adds the magnitude errors to the BC cases. All four of these variations follow the min-max normalization defined in Eq. (4). Additionally, we show the BCEp and BCEn sets, for which bands and colours were min-max normalized separately to the errors, obtained with Eqs. (5) and (6) respectively. The distribution of galaxies among the five validation folds is fixed to be the same. Panel (A) corresponds to the model magnitude type, (B) to the fibre magnitude, (C) to the PSF magnitude, (D) to the Petrosian magnitude, (E) to the exponential magnitude, and (F) to the De Vaucouleurs one.
Current usage metrics show cumulative count of Article Views (full-text article views including HTML views, PDF and ePub downloads, according to the available data) and Abstracts Views on Vision4Press platform.
Data correspond to usage on the plateform after 2015. The current usage metrics is available 48-96 hours after online publication and is updated daily on week days.
Initial download of the metrics may take a while.