Open Access
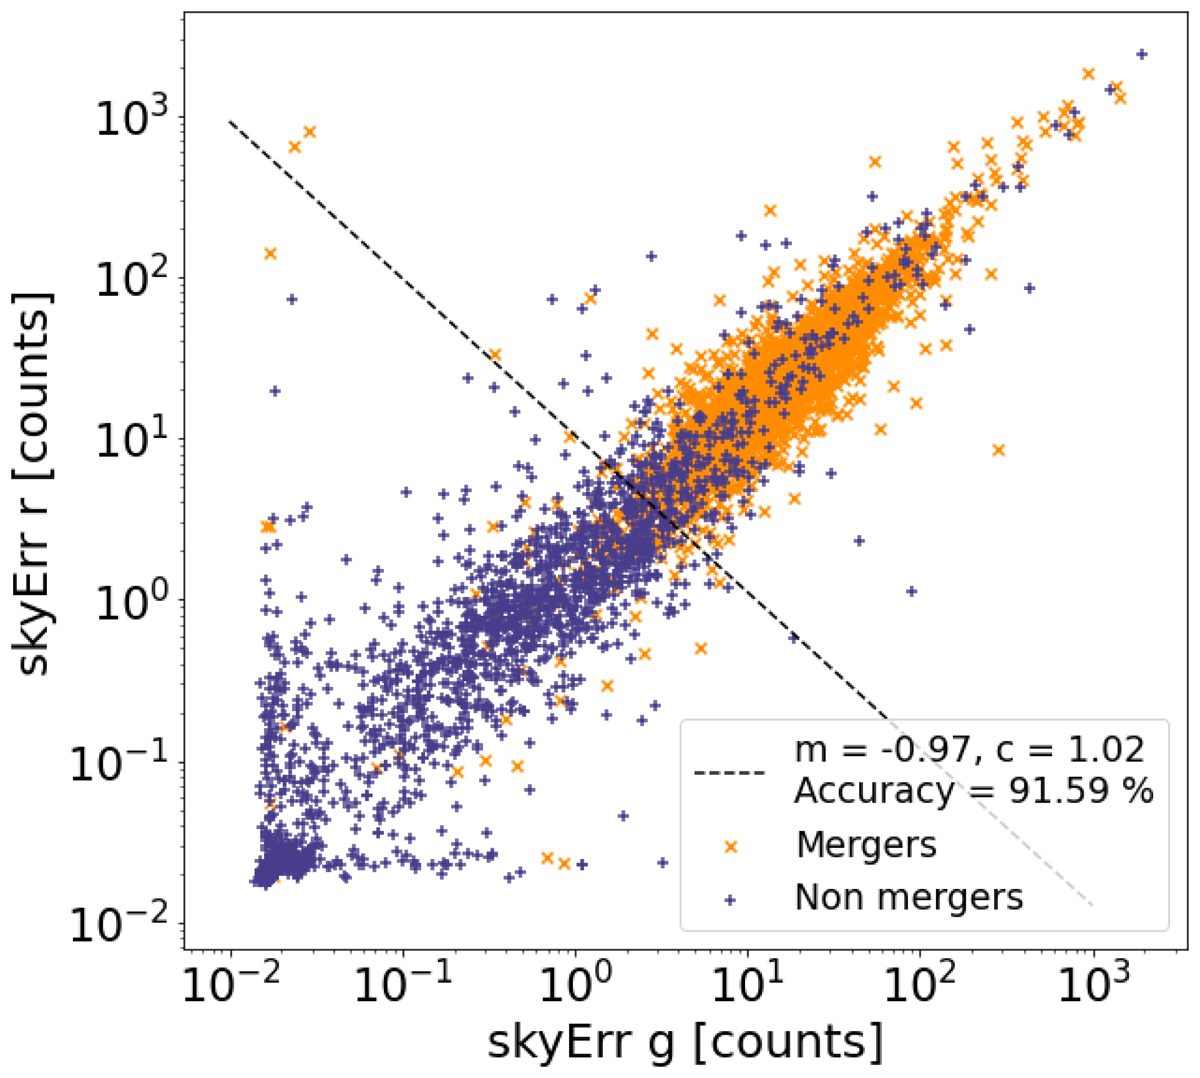
Fig. 11.
Download original image
Distribution of galaxies in the 2D plane of skyErr in the g and r bands. The mergers are shown by orange crosses and the non-mergers by dark blue plus symbols. The boundary is the dashed black line, with its parameters given in the label, together with the accuracy of the classification using this cut.
Current usage metrics show cumulative count of Article Views (full-text article views including HTML views, PDF and ePub downloads, according to the available data) and Abstracts Views on Vision4Press platform.
Data correspond to usage on the plateform after 2015. The current usage metrics is available 48-96 hours after online publication and is updated daily on week days.
Initial download of the metrics may take a while.