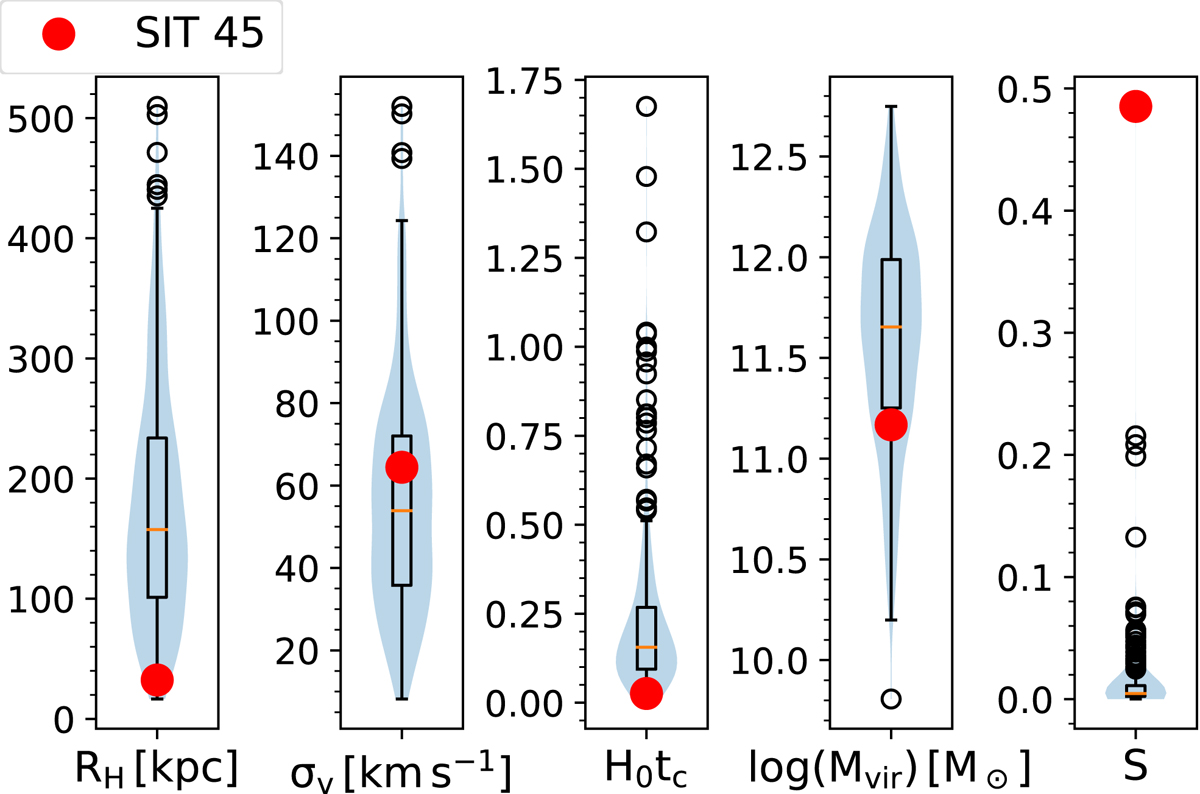
Fig. 7.
Download original image
Comparison of the dynamical parameters found for SIT 45 (red filled circles) with respect to the SIT. From left to right are shown the projected harmonic radius (RH), velocity dispersion (σv), crossing time (H0tc), virial mass (Mvir), and compactness of the triplet (S). The pale blue violin shape corresponds to a density diagram, rotated and placed on each side, to show the form of the data distribution for each dynamical parameter. The box inside the main body of the violin diagram shows the interquartile range (IQR) of the median (represented by the orange horizontal line) and its 95% confidence intervals. The vertical lines starting from the inner box correspond to 1.5 × IQR. The atypical values of the distribution are represented by black open circles.
Current usage metrics show cumulative count of Article Views (full-text article views including HTML views, PDF and ePub downloads, according to the available data) and Abstracts Views on Vision4Press platform.
Data correspond to usage on the plateform after 2015. The current usage metrics is available 48-96 hours after online publication and is updated daily on week days.
Initial download of the metrics may take a while.