| Issue |
A&A
Volume 691, November 2024
|
|
|---|---|---|
| Article Number | A341 | |
| Number of page(s) | 6 | |
| Section | Extragalactic astronomy | |
| DOI | https://doi.org/10.1051/0004-6361/202450675 | |
| Published online | 25 November 2024 | |
Effect of the local and large-scale environment on the star formation histories of galaxies
1
Universidad de Granada, Departamento de Física Teórica y del Cosmos, Campus Fuentenueva, Edificio Mecenas, 18071 Granada, Spain
2
Instituto Carlos I de Física Teórica y Computacional, Facultad de Ciencias, 18071 Granada, Spain
3
Département de Physique, de Génie Physique et d’Optique, Université Laval, and Centre de Recherche en Astrophysique du Québec (CRAQ), Québec, QC G1V 0A6, Canada
4
Instituto de Astrofísica de Andalucía – CSIC, Glorieta de la Astronomía s.n., 18008 Granada, Spain
5
Instituto de Astrofísica de Canarias, Vía Láctea s/n, 38205 La Laguna, Tenerife, Spain
6
Departamento de Astrofísica, Universidad de La Laguna, 38200 La Laguna, Tenerife, Spain
7
Departamento de Física de la Tierra y Astrofísica IPARCOS, UCM, 28040 Madrid, Spain
⋆ Corresponding author; gloriatr@ugr.es
Received:
10
May
2024
Accepted:
27
September
2024
Context. The specific environment of galaxies may play a key role in their evolution. Large extragalactic surveys make it possible to study galaxies not only within their local environment, but also within the large-scale structure of the Universe.
Aims. We aim to investigate how the local environment influences the star formation history (SFH) of galaxies across a range of large-scale environments.
Methods. We categorised a sample of 9384 galaxies into the three primary large-scale structures (voids, walls and filaments, and clusters). We further classified them based on their local environment (as either ‘singlets’ or group members) through a search of companion galaxies within sky-projected distances of Δrp < 0.45 Mpc and velocity differences of Δv < 160 km s−1. Subsequently, we explored these subsamples using SFH data from previous works. Throughout this study, we divided galaxies into long-timescale SFH galaxies (LT-SFH), which assemble their mass steadily along cosmic time, and short-timescale SFH galaxies (ST-SFH), which form their stars early on. We then compared their characteristic mass assembly look-back times.
Results. The distributions of mass assembly look-back times in ST-SFH galaxies are statistically different for singlets and groups. These differences are only found in LT-SFH galaxies when studying these distributions in stellar mass bins. Our results indicate that the large-scale environment is related to a delay in mass assembly of up to ∼2 Gyr, while this delay is < 1 Gyr in the case of local environment. The effects of both types of environment are more significant in less massive galaxies and in LT-SFHs.
Conclusions. Our results are consistent with galaxies in groups assembling their stellar mass earlier than in singlets, especially in voids and lower mass galaxies. Local environment plays a relevant role in stellar mass assembly times, although we find that large-scale structures also cause a delay in mass assembly, and all the more so in the case of cluster galaxies.
Key words: galaxies: evolution / galaxies: groups: general / galaxies: star formation / large-scale structure of Universe
© The Authors 2024
 Open Access article, published by EDP Sciences, under the terms of the Creative Commons Attribution License (https://creativecommons.org/licenses/by/4.0), which permits unrestricted use, distribution, and reproduction in any medium, provided the original work is properly cited.
This article is published in open access under the Subscribe to Open model. Subscribe to A&A to support open access publication.
1. Introduction
Mass assembly and star formation in galaxies constitute a pivotal focus within the study of galaxy evolution. Environment plays a relevant role in these processes, and it is now possible, in the time of large extragalactic surveys, to examine them thoroughly across different spatial, extragalactic scales. Within the context of the large-scale structure of the universe (LSS), void environments emerge as regions characterised by an average underdensity, hosting galaxies in their most pristine states and predominantly featuring bluer, disc-like galaxies, with active star formation (Rojas et al. 2004, 2005; Florez et al. 2021; Rodríguez-Medrano et al. 2023). Conversely, higher density environments yield redder, elliptical galaxies, as predicted by the morphology-density relation (Dressler 1980). It is thus reasonable to conceive environment density as a potential driver for the suppression of star formation; as a matter of fact, mass and environment have previously been proposed as two main, independent mechanisms for galaxy quenching (Peng et al. 2010).
The effect of extragalactic environment on local scales has been extensively studied, specially in terms of close pairs, compact groups, and merging systems. There is evidence of enhanced star formation in close pairs of galaxies, with the highest enhancement in pairs of galaxies of similar mass and a decrease towards higher separations in the sky plane (Lambas et al. 2003; Ellison et al. 2008; Patton et al. 2011; Scudder et al. 2012). However, Patton et al. (2013) showed clear evidence of enhanced star formation in pairs up to a ∼150 kpc separation, making use of both observational and simulation techniques. Regarding merger systems, Ellison et al. (2010) showed how the enhancement of post-merger star formation is higher in low-intermediate density environments, in addition to higher asymmetry, bluer bulges, and higher bulge-to-total flux fractions. On the other hand, simulations focusing on central-satellite dynamics find that satellite galaxies suffer rapid quenching episodes after the infall into their host halos (Wetzel et al. 2013; Park et al. 2023).
Despite the extensive literature addressing the impact of local environment on galaxy evolution, the interplay between local and large-scale environments and their collective influence on galaxies remains an almost unexplored frontier. Duplancic et al. (2018) discussed the notion that galaxies in pairs are more likely to present enhanced star formation due to galaxy interactions (in agreement with previous works, e.g. Barnes & Hernquist 1996) than galaxies in triplets and groups, which are prone to suffer quenching due to the multiple interactions within the group. It was later discussed in Duplancic et al. (2020) that those effects may be caused not only by the number of galaxies in the group, but by the implicit LSS. Other recent studies have focussed on different aspects related to this local and global interplay, such as properties (i.e. colour, star formation rate, and concentration) of void galaxies in groups (Rodríguez-Medrano et al. 2023), brightest group galaxies (Kuutma et al. 2020; Einasto et al. 2024), compact groups (Taverna et al. 2023), or isolated triplets (Vásquez-Bustos et al. 2023) in diverse LSS environments. All these works have reported the finding that group galaxy properties are influenced by their position in the cosmic web, although how this influence acts on galaxies over time is still a missing piece of the overall puzzle. In this work, we make our contribution to this quest by looking further to the past through star formation histories (SFHs) in galaxies of different local and global environments.
This paper is structured as follows. In Sect. 2, we describe the data and samples used in this work, as well as the large- and local-scale environment classification of the galaxy sample. In Sect. 3, we explore the SFHs of the different subsamples. We discuss the results in Sect. 4. Finally, we present a summary of the work and our main conclusions in Sect. 5. Throughout the study, a cosmology with ΩΛ0 = 0.7, Ωm0 = 0.3, and H0 = 67.8 km s−1 Mpc−1 has been considered.
2. Data and sample
The main sample contains 9384 galaxies within the redshift range of 0.01 < z < 0.05 and stellar mass range of log(M⋆/M⊙) > 9.0, with SFH data provided by Domínguez-Gómez et al. (2023), as well as information about their LSS and local environment. In the following, we address several details related to the determination of SFHs and the environmental characterisation.
In Domínguez-Gómez et al. (2023), the SFHs were estimated through the application of stellar spectrum models (Vazdekis et al. 2016) to spectra from Sloan Digital Sky Survey Data Release 16 (SDSS DR16; Ahumada et al. 2020). The extraction of stellar populations was facilitated using a combination of full-spectral fitting codes; namely, the penalised pixel fitting (PPXF; Cappellari 2017) code and the STEllar Content and Kinematics from high-resolution galactic spectra algorithm (STECKMAP; Ocvirk et al. 2006). Our study starts off with a set of 10807 galaxies with computed SFHs (987 in voids, 6463 in filaments and 3357 in clusters, according to Domínguez-Gómez et al. 2023).
To constrain the local environment, we made use of the galaxy catalogue given by Tempel et al. (2017). This catalogue contains 584 449 galaxies from SDSS DR12 (Eisenstein et al. 2011), providing information on galaxy groups and clusters; however, it is not restricted to galaxies in groups. The catalogue provides a clean, large galaxy sample that is suitable for this investigation into the local environment. Companion galaxies were searched for every galaxy within velocity differences Δv ≤ 160 km s−1 and sky-projected distances Δrp ≤ 0.45 Mpc, following the criteria for physical bounding presented in Argudo-Fernández et al. (2015). Evidence of physical bounding in isolated pairs and triplets was found to exist within those conditions; hence, these criteria outline a conservative approach for considering galaxies in groups. This search is carried out within the Tempel et al. (2017) catalogue itself. In this study, galaxies are classified as either singlets or group members, regarding the absence or presence of a companion given the aforementioned conditions. Consequently, group galaxies are those with a number of neighbours, Nneigh ≥ 1.
The final dataset is obtained through the crossmatch of the 10 807 galaxies with SFH data and the Tempel et al. (2017) catalogue, for which we have determined local environment. We are left with 9862 galaxies, which we characterise with respect to their placement within the LSS of the Universe, following the methodology given in Domínguez-Gómez et al. (2023). We identify void galaxies by cross-referencing the dataset with a void galaxy catalogue (Pan et al. 2012). We consider cluster galaxies to be those which are part of groups of 30 or more galaxies (Abell et al. 1989) in the group catalogue by Tempel et al. (2017). All other galaxies are categorised as filament or wall galaxies, henceforth referred to as ‘filament galaxies’. We discarded 242 galaxies that appear to be void and cluster galaxies simultaneously, according to the described criteria.
Lastly, as we are aiming to create a volume-limited sample to ensure a proper environment characterisation, we applied a stellar mass cut of log(M⋆/M⊙) > 9 on both our primary sample and the catalogue provided by Tempel et al. (2017), used for the local environment characterisation. We were left with the final dataset of 9384 galaxies, which comprises 913 galaxies in voids, 5388 in filaments, and 3083 in clusters. In terms of the local environment, 5303 galaxies are part a group (Nneigh ≥ 1), while 4081 galaxies are singlets. In Table 1, a breakdown of the galaxy sample is given.
Summary of the environment classification of the galaxy sample.
3. Results
In this section, we describe the mass assembly look-back time distributions across different environments and explore how local and large-scale structure environments influence these patterns.
3.1. Mass assembly look-back time distributions
Mass assembly look-back time (T%) is defined as the span of time elapsed since a galaxy acquired a specific portion of its current stellar mass (T50 for 50%, T70 for 70%, and so on). Larger look-back times denote earlier times in the history of the Universe and, as a result, T50 > T70 > T90. It is a representative parameter of the SFH and is used consistently throughout this work. Moreover, galaxies are classified into two types regarding their SFH: galaxies with short-timescale SFH (ST-SFH) assemble most of their mass quickly and early; whereas long-timescale SFH (LT-SFH) galaxies assemble their mass steadily along cosmic time. According to Domínguez-Gómez et al. (2023), this classification is independent of the LSS location.
Figure 1 displays the look-back time distributions for both singlet and group galaxies, encompassing all LSS environments. In the left-hand panel, corresponding to ST-SFHs, the dissimilarity between the distributions of singlet and group galaxy samples becomes evident, as the mode of the distributions of group members reaches larger look-back times values, especially in regions of lower density and more recent time periods. We find the highest delay in median values in T90 void galaxy distributions (0.8 Gyr), which decreases in T70 and T50 (0.6 Gyr and < 0.2 Gyr, respectively). This distinction is no longer discernible in LT-SFHs (right-hand panel), where the distributions are broader and statistically similar for singlets and galaxies in groups. This outcome is substantiated by the results of the two-sample Kolmogorov–Smirnov tests conducted for each panel. In ST-SFH galaxies, only 2 out of 9 p-values are greater than 0.05 (T50 distributions in filaments and clusters); however, in LT-SFH galaxies, only filament galaxies show p-values under 0.05. As a result, the null hypothesis (that the two samples are drawn from the same distribution) can be rejected in ST-SFH galaxies, and therefore we can assume that singlets and galaxies in groups have inherently different assembly look-back time distributions, whereas this is not true for LT-SFH galaxies.
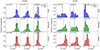 |
Fig. 1. Stellar mass assembly look-back time distributions (T50, T70, and T90) for singlets (black solid line) and galaxies in groups (colour-filled). Left: ST-SFH galaxies; Right: LT-SFH galaxies. The LSS environment is indicated on the right axis and is colour-coded (voids in blue, filaments and walls in green, and clusters in red). The median of the distribution appears in solid cyan (group members) and dashed black (singlets) vertical lines. The values on the upper left corner correspond to the p-value from the Kolmogorov-Smirnov tests conducted between singlets and grouped galaxies distributions in each subpanel. All distributions contain over 150 galaxies. |
3.2. Assembly times and stellar mass
Figure 2 illustrates the look-back time distributions within stellar mass bins for various local and LSS environment subsamples. If all SFH types are considered, the distributions follow the trend of LT-SFHs and appear to be generally widened to cover ST-SFHs distributions. Consistent with previous findings (Domínguez-Gómez et al. 2023), ST-SFH distributions are nearly constant with stellar mass, as opposed to LT-SFHs, in which lower look-back times are evident in the lower mass distributions. In ST-SFH galaxies, this result is found in cluster galaxy samples over all distributions (T50, T70, and T90). However, ST-SFH void galaxies smoothly transition to resemble LT-SFH galaxies with increasing mass fraction: low mass galaxies display lower T70 and T90 than higher mass galaxies, especially in the case of galaxies in groups; this is in spite of the constant trend with mass seen in T50 distributions. A similar behaviour is only mildly noticeable in filament galaxies.
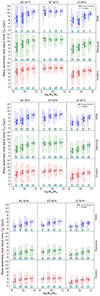 |
Fig. 2. Mass assembly look-back time distributions vs. stellar mass for singlets (empty boxes) and grouped galaxies (filled boxes) in voids (blue), filaments and walls (green) and clusters (red). Upper, middle and lower panels correspond to T50, T70 and T90 distributions, respectively. The stellar mass bins are distributed from 109 to 1011 M⊙, in 0.5 dex intervals. Numbers at the lower end of each panel correspond to the size of the subsamples (black for singlets and cyan for galaxies in groups). |
The mass assembly look-back times distributions of singlets and groups exhibit both very similar behaviours, up to the point that they appear visually indistinguishable in ST-SFH galaxies. Notable discrepancies appear in LT-SFH galaxies within clusters, where it seems that group members may have assembled their stellar mass earlier than singlets, particularly in lower mass distributions. These differences are not observed in void and filament galaxies with LT-SFH, although it is unclear whether the distributions are identical for singlet and group galaxies in those environments. Nevertheless, Fig. 2 demonstrates that singlets and group galaxies do not exhibit a correlation between their SFHs and ST and LT-SFH types. Consequently, we can conclude that the local environment is not a primary driver of the observed SFH bimodality.
A parametrisation of the effect of local (Δlocal) and LSS environments (ΔC, V, ΔF, V, and ΔC, F) on SFHs can be found in Fig. 3. For every two environments compared, these Δenv parameters are obtained by subtracting the mean T% of the less dense to the denser environment. In the case of the LSS environments, all combinations have been considered. The result is a quantification of the mean delay caused by environment density. According to these results, low mass galaxies are significantly more affected than high mass galaxies, although the delay caused by clusters with respect to any other LSS environment is also found in high mass galaxies. In general, these delays are the most significant (up to ∼2 Gyr), followed by the differences of groups with respect to singlets (Δlocal < 0.9 Gyr). We find the lowest values when comparing voids and filaments (ΔF, V < 0.6 Gyr). Regarding SFH types, ST-SFH galaxies are affected in a similar manner by all environments when assembling 50% of their mass, in contrast to later in time. LT-SFH galaxies show the largest delays, and impact greatly on the full sample, as previously seen in Fig. 2.
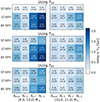 |
Fig. 3. Delay in mean mass assembly look-back times caused by environment (Δenv). The results using T50, T70, and T90 appear in the first, second, and third panels, reading from top to bottom. We consider galaxies of low (109 − 1010 M⊙) and high masses (1010 − 1011 M⊙) on the left and right panels. Every column corresponds to a Δenv value, where C, F, and V depict clusters, filaments, and voids respectively, aiming to compare every LSS environment. Also, Δlocal corresponds to the difference between groups and singlets. Rows in every panel depict SFH types (short-timescale SFH, long-timescale SFH, or both altogether). |
4. Discussion
4.1. Mass assembly look-back time distributions
The mass assembly history in different local and global environments can be inferred from the look-back time distributions in Fig. 1. In galaxies with ST-SFH, the median of the T50 distributions takes the value ∼11 Gyr, independently of the kind of local or LSS environment. At those early times (∼3 Gyr after the Big Bang), the density contrasts between the forthcoming LSS were minor. Consequently, not finding significant differences both in local and LSS environments could be expected, as it is a reflection of the more homogeneous environment galaxies were embedded in during that early cosmological time. Differences appear in the T70 distributions, in which voids show wider distributions and singlets form the 70% of their mass later than galaxies in groups and therefore evolve more slowly. This effect is accentuated in the T90 distributions, where there is a ∼2 Gyr difference between the mode of the singlets and group members distributions in voids. These results point towards an accelerated evolutionary scenario for ST-SFH galaxies in groups. However, the physical scenario depends heavily on the mass of the galaxy and the characteristics of the group (e.g. number of members, compactness, etc.) as supported by previous studies (Duplancic et al. 2018, 2020).
On the right panel of Fig. 1 we find galaxies with LT-SFH type. These galaxies assemble their mass progressively, exhibiting wider distributions in look-back time. Void galaxies assemble their mass slower than cluster galaxies and, therefore, the maxima of the distributions are shifted towards more recent cosmic times in less dense environments. In LT-SFH galaxies, the effect of local environment does not emerge as clearly as in ST-SFH galaxies.
4.2. Assembly times and stellar mass
To see how the masses in central and satellite galaxies are distributed in the different environments, we created a subsample of galaxies in pairs in our catalogue for a companion search and identified the central galaxy in each pair as the one with the largest stellar mass. In our main sample of 9384 galaxies, 1284 galaxies (13.4%) are part of pairs. Fig. 4 illustrates the mass distributions of central and satellite galaxies, corresponding to the 1174 galaxies in pairs with both the central and satellite galaxy in the same LSS environment. It can be seen how dense environments contain more massive galaxies, with less difference in the distributions of central and satellite galaxies, in opposition to void galaxies. Hence, as illustrated in Fig. 2, satellites undergo more effective quenching in high-density environments. This is noticeable by their large look-back times compared to singlets in low-mass galaxies. These findings are aligned with prior research, both in terms of simulations and observations, highlighting a correlation between increased quenching efficiency and the mass of the host halo (Pasquali et al. 2019; Gallazzi et al. 2021; Park et al. 2023).
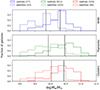 |
Fig. 4. Stellar mass distributions of galaxies in galaxy pairs. From top to bottom: Blue, green, and red histograms depict samples in voids, filaments, and clusters. Dashed and solid lines correspond to the median values of the distributions of satellites and centrals, respectively. The numbers in the legend correspond to the subsample sizes. |
Recent works in simulations (Rosas-Guevara et al. 2022; Rodríguez-Medrano et al. 2024) find that void galaxies tend to experience later mergers than galaxies in denser environments, leading to mass accretion in later cosmic times. These results align with later look-back times in voids, and motivates further investigation into the SFHs of mergers in voids. Additionally, they find that central galaxies do not exhibit many differences in between LSS environments, in agreement with our results regarding high mass galaxies, along with other studies on the brightest group galaxies (Kuutma et al. 2020; Einasto et al. 2024).
Ultimately, it can be understood that the SFH of galaxies is influenced by their local environment, although the influence of the LSS of the Universe can be larger in the densest structures. In any case, the nature of these influences is conditioned by stellar mass. The root of the differences in between global environments is yet unclear, although several mechanisms have been proposed in previous studies, such as the prevalence of the cold accretion mode of gas (Kereš et al. 2005). Domínguez-Gómez et al. (2023) has offered additional discussion on this topic. It is noteworthy that the bimodal nature of SFHs persists regardless of the environmental context as addressed in this work.
5. Summary and conclusions
We have characterised the local and large-scale environment of 9384 galaxies, with the aim of analysing SFHs and the possible evolutionary paths driven by the local environment. The sample is divided in three large-scale structures (voids, walls and filaments, and clusters) and two possible local environment classifications (singlets or group members) regarding the presence or absence of companions within the reach of physical bounding.
The following constitute our main results:
-
We address the bimodality in SFHs found by Domínguez-Gómez et al. (2023). As defined in the aforementioned work and explained in Sect. 3, two main types of SFHs appear to exist: ST-SFHs and LT-SFHs. This bimodality emerges clearly in both the group and singlet samples. Therefore, the local environment is not the main driving mechanism of the SFH bimodality.
-
Mass assembly look-back time distributions indicate that ST-SFH galaxies in groups assemble their stellar mass earlier than singlets. When considering look-back times with respect to stellar mass bins, we also find this result for LT-SFH galaxies. These results point towards a common evolutionary background for galaxies in groups. This scenario is likely to alter SFHs in different ways in satellite and central galaxies, suppressing or inducing star formation.
-
Environment influences the SFHs of galaxies. The LSS environment can cause a delay in stellar mass assembly of up to ∼2 Gyr, < 1 Gyr in the case of local environment. The effect of both environments is more significant in less massive galaxies and in LT-SFH galaxies. There are no large differences between the SFHs of void and filament galaxies, finding the largest differences when comparing galaxies inhabiting clusters to others populating voids or filaments.
Given the dynamical nature of the large-scale structure of the universe, works such as this one, which rely on observational data to trail galaxies to their birth, can gain invaluable benefits from the support of hydrodynamical simulations. In these simulations, tracing the environment of galaxies over cosmic time may become possible, a task that is inherently unfeasible for observations. Moreover, we require a more comprehensive understanding of the physical mechanisms that drive star formation in galaxies to fully interpret the presented results.
In spite of these limitations, this study has, for the first time, demonstrated that statistical discrepancies emerge in the star formation histories of galaxies across a range of local environments. We note that a similar result was found for large-scale environments in Domínguez-Gómez et al. (2023).
Acknowledgments
We are grateful to the anonymous referee, whose suggestions truly helped the authors to improve this manuscript. We acknowledge financial support from the research project PRE2021-098736 funded by MCIN/AEI/10.13039/501100011033 and FSE+. We acknowledge financial support by the research projects AYA2017-84897-P, PID2020-113689GB-I00, and PID2020-114414GB-I00, financed by MCIN/AEI/10.13039/501100011033, the project A-FQM-510-UGR20 financed from FEDER/Junta de Andalucía-Consejería de Transformación Económica, Industria, Conocimiento y Universidades/Proyecto and by the grants P20_00334 and FQM108, financed by the Junta de Andalucía (Spain). M.A.-F. acknowledges support from the Emergia program (EMERGIA20_38888) from Consejería de Universidad, Investigación e Innovación de la Junta de Andalucía. S.D.P. acknowledges financial support from Juan de la Cierva Formación fellowship (FJC2021-047523-I) financed by MCIN/AEI/10.13039/501100011033 and by the European Union ‘NextGenerationEU’/PRTR, Ministerio de Economía y Competitividad under grants PID2019-107408GB-C44, PID2022-136598NB-C32, and is grateful to the Natural Sciences and Engineering Research Council of Canada, the Fonds de Recherche du Québec, and the Canada Foundation for Innovation for funding. T.R.L. acknowledges support from Juan de la Cierva fellowship (IJC2020-043742-I). R.G.B., R.G.D., and A.C., acknowledge financial support from the Severo Ochoa grant CEX2021-001131-S funded by MCIN/AEI/10.13039/501100011033 and PID2022-141755NB-I00 and PID2019-109067GB-I00. J.F.-B. acknowledges support from the PID2022-140869NB-I00 grant from the Spanish Ministry of Science and Innovation. We acknowledge financial support from the grant AST22.4.4, funded by Consejería de Universidad, Investigación e Innovación and Gobierno de España and Unión Europea – NextGenerationEU, and by PID2020-113689GB-I00, financed by MCIN/AEI. This research made use of Astropy, a community-developed core Python (http://www.python.org) package for astronomy (Astropy Collaboration 2022); ipython (Pérez & Granger 2007); matplotlib (Hunter 2007); SciPy, a collection of open-source software for scientific computing in Python (Virtanen et al. 2020); and NumPy, a structure for efficient numerical computation (Harris et al. 2020). Funding for the SDSS and SDSS-II has been provided by the Alfred P. Sloan Foundation, the Participating Institutions, the National Science Foundation, the U.S. Department of Energy, the National Aeronautics and Space Administration, the Japanese Monbukagakusho, the Max Planck Society, and the Higher Education Funding Council for England. The SDSS Web Site is http://www.sdss.org/
References
- Abell, G. O., Corwin, H. G., & Olowin, R. P. 1989, ApJS, 70, 1 [Google Scholar]
- Ahumada, R., Allende Prieto, C., Almeida, A., et al. 2020, ApJS, 249, 3 [NASA ADS] [CrossRef] [Google Scholar]
- Argudo-Fernández, M., Verley, S., Bergond, G., et al. 2015, A&A, 578, A110 [NASA ADS] [CrossRef] [EDP Sciences] [Google Scholar]
- Astropy Collaboration (Price-Whelan, A. M., et al.) 2022, ApJ, 935, 167 [NASA ADS] [CrossRef] [Google Scholar]
- Barnes, J. E., & Hernquist, L. 1996, ApJ, 471, 115 [NASA ADS] [CrossRef] [Google Scholar]
- Cappellari, M. 2017, MNRAS, 466, 798 [Google Scholar]
- Domínguez-Gómez, J., Pérez, I., Ruiz-Lara, T., et al. 2023, Nature, 619, 269 [CrossRef] [Google Scholar]
- Dressler, A. 1980, ApJ, 236, 351 [Google Scholar]
- Duplancic, F., Coldwell, G. V., Alonso, S., & Lambas, D. G. 2018, MNRAS, 481, 2458 [NASA ADS] [CrossRef] [Google Scholar]
- Duplancic, F., Dávila-Kurbán, F., Coldwell, G. V., Alonso, S., & Galdeano, D. 2020, MNRAS, 493, 1818 [CrossRef] [Google Scholar]
- Einasto, M., Einasto, J., Tenjes, P., et al. 2024, A&A, 681, A91 [NASA ADS] [CrossRef] [EDP Sciences] [Google Scholar]
- Eisenstein, D. J., Weinberg, D. H., Agol, E., et al. 2011, AJ, 142, 72 [Google Scholar]
- Ellison, S. L., Patton, D. R., Simard, L., & McConnachie, A. W. 2008, AJ, 135, 1877 [NASA ADS] [CrossRef] [Google Scholar]
- Ellison, S. L., Patton, D. R., Simard, L., et al. 2010, MNRAS, 407, 1514 [NASA ADS] [CrossRef] [Google Scholar]
- Florez, J., Berlind, A. A., Kannappan, S. J., et al. 2021, ApJ, 906, 97 [NASA ADS] [CrossRef] [Google Scholar]
- Gallazzi, A. R., Pasquali, A., Zibetti, S., & Barbera, F. L. 2021, MNRAS, 502, 4457 [NASA ADS] [CrossRef] [Google Scholar]
- Harris, C. R., Millman, K. J., van der Walt, S. J., et al. 2020, Nature, 585, 357 [NASA ADS] [CrossRef] [Google Scholar]
- Hunter, J. D. 2007, Comput. Sci. Eng., 9, 90 [NASA ADS] [CrossRef] [Google Scholar]
- Kereš, D., Katz, N., Weinberg, D. H., & Davé, R. 2005, MNRAS, 363, 2 [Google Scholar]
- Kuutma, T., Poudel, A., Einasto, M., et al. 2020, A&A, 639, A71 [NASA ADS] [CrossRef] [EDP Sciences] [Google Scholar]
- Lambas, D. G., Tissera, P. B., Alonso, M. S., & Coldwell, G. 2003, MNRAS, 346, 1189 [NASA ADS] [CrossRef] [Google Scholar]
- Ocvirk, P., Pichon, C., Lançon, A., & Thiébaut, E. 2006, MNRAS, 365, 74 [Google Scholar]
- Pan, D. C., Vogeley, M. S., Hoyle, F., Choi, Y.-Y., & Park, C. 2012, MNRAS, 421, 926 [NASA ADS] [CrossRef] [Google Scholar]
- Park, S.-M., Chun, K., Shin, J., et al. 2023, ApJ, 954, 98 [NASA ADS] [CrossRef] [Google Scholar]
- Pasquali, A., Smith, R., Gallazzi, A., et al. 2019, MNRAS, 484, 1702 [Google Scholar]
- Patton, D. R., Ellison, S. L., Simard, L., McConnachie, A. W., & Mendel, J. T. 2011, MNRAS, 412, 591 [NASA ADS] [CrossRef] [Google Scholar]
- Patton, D. R., Torrey, P., Ellison, S. L., Mendel, J. T., & Scudder, J. M. 2013, MNRAS, 433, L59 [CrossRef] [Google Scholar]
- Peng, Y.-J., Lilly, S. J., Kovač, K., et al. 2010, ApJ, 721, 193 [Google Scholar]
- Pérez, F., & Granger, B. E. 2007, Comput. Sci. Eng., 9, 21 [Google Scholar]
- Rodríguez-Medrano, A. M., Paz, D. J., Stasyszyn, F. A., et al. 2023, MNRAS, 521, 916 [CrossRef] [Google Scholar]
- Rodríguez-Medrano, A. M., Springel, V., Stasyszyn, F. A., & Paz, D. J. 2024, MNRAS, 528, 2822 [CrossRef] [Google Scholar]
- Rojas, R. R., Vogeley, M. S., Hoyle, F., & Brinkmann, J. 2004, ApJ, 617, 50 [NASA ADS] [CrossRef] [Google Scholar]
- Rojas, R. R., Vogeley, M. S., Hoyle, F., & Brinkmann, J. 2005, ApJ, 624, 571 [NASA ADS] [CrossRef] [Google Scholar]
- Rosas-Guevara, Y., Tissera, P., Lagos, C. D. P., Paillas, E., & Padilla, N. 2022, MNRAS, 517, 712 [NASA ADS] [CrossRef] [Google Scholar]
- Scudder, J. M., Ellison, S. L., Torrey, P., Patton, D. R., & Mendel, J. T. 2012, MNRAS, 426, 549 [NASA ADS] [CrossRef] [Google Scholar]
- Taverna, A., Salerno, J. M., Daza-Perilla, I. V., et al. 2023, MNRAS, 520, 6367 [CrossRef] [Google Scholar]
- Tempel, E., Tuvikene, T., Kipper, R., & Libeskind, N. I. 2017, A&A, 602, A100 [NASA ADS] [CrossRef] [EDP Sciences] [Google Scholar]
- Vásquez-Bustos, P., Argudo-Fernandez, M., Grajales-Medina, D., Duarte Puertas, S., & Verley, S. 2023, A&A, 670, A63 [NASA ADS] [CrossRef] [EDP Sciences] [Google Scholar]
- Vazdekis, A., Koleva, M., Ricciardelli, E., Röck, B., & Falcón-Barroso, J. 2016, MNRAS, 463, 3409 [Google Scholar]
- Virtanen, P., Gommers, R., Oliphant, T. E., et al. 2020, Nat. Meth., 17, 261 [Google Scholar]
- Wetzel, A. R., Tinker, J. L., Conroy, C., & van den Bosch, F. C. 2013, MNRAS, 432, 336 [Google Scholar]
All Tables
All Figures
|
Fig. 1. Stellar mass assembly look-back time distributions (T50, T70, and T90) for singlets (black solid line) and galaxies in groups (colour-filled). Left: ST-SFH galaxies; Right: LT-SFH galaxies. The LSS environment is indicated on the right axis and is colour-coded (voids in blue, filaments and walls in green, and clusters in red). The median of the distribution appears in solid cyan (group members) and dashed black (singlets) vertical lines. The values on the upper left corner correspond to the p-value from the Kolmogorov-Smirnov tests conducted between singlets and grouped galaxies distributions in each subpanel. All distributions contain over 150 galaxies. |
| In the text | |
|
Fig. 2. Mass assembly look-back time distributions vs. stellar mass for singlets (empty boxes) and grouped galaxies (filled boxes) in voids (blue), filaments and walls (green) and clusters (red). Upper, middle and lower panels correspond to T50, T70 and T90 distributions, respectively. The stellar mass bins are distributed from 109 to 1011 M⊙, in 0.5 dex intervals. Numbers at the lower end of each panel correspond to the size of the subsamples (black for singlets and cyan for galaxies in groups). |
| In the text | |
|
Fig. 3. Delay in mean mass assembly look-back times caused by environment (Δenv). The results using T50, T70, and T90 appear in the first, second, and third panels, reading from top to bottom. We consider galaxies of low (109 − 1010 M⊙) and high masses (1010 − 1011 M⊙) on the left and right panels. Every column corresponds to a Δenv value, where C, F, and V depict clusters, filaments, and voids respectively, aiming to compare every LSS environment. Also, Δlocal corresponds to the difference between groups and singlets. Rows in every panel depict SFH types (short-timescale SFH, long-timescale SFH, or both altogether). |
| In the text | |
|
Fig. 4. Stellar mass distributions of galaxies in galaxy pairs. From top to bottom: Blue, green, and red histograms depict samples in voids, filaments, and clusters. Dashed and solid lines correspond to the median values of the distributions of satellites and centrals, respectively. The numbers in the legend correspond to the subsample sizes. |
| In the text | |
Current usage metrics show cumulative count of Article Views (full-text article views including HTML views, PDF and ePub downloads, according to the available data) and Abstracts Views on Vision4Press platform.
Data correspond to usage on the plateform after 2015. The current usage metrics is available 48-96 hours after online publication and is updated daily on week days.
Initial download of the metrics may take a while.