Fig. 3.
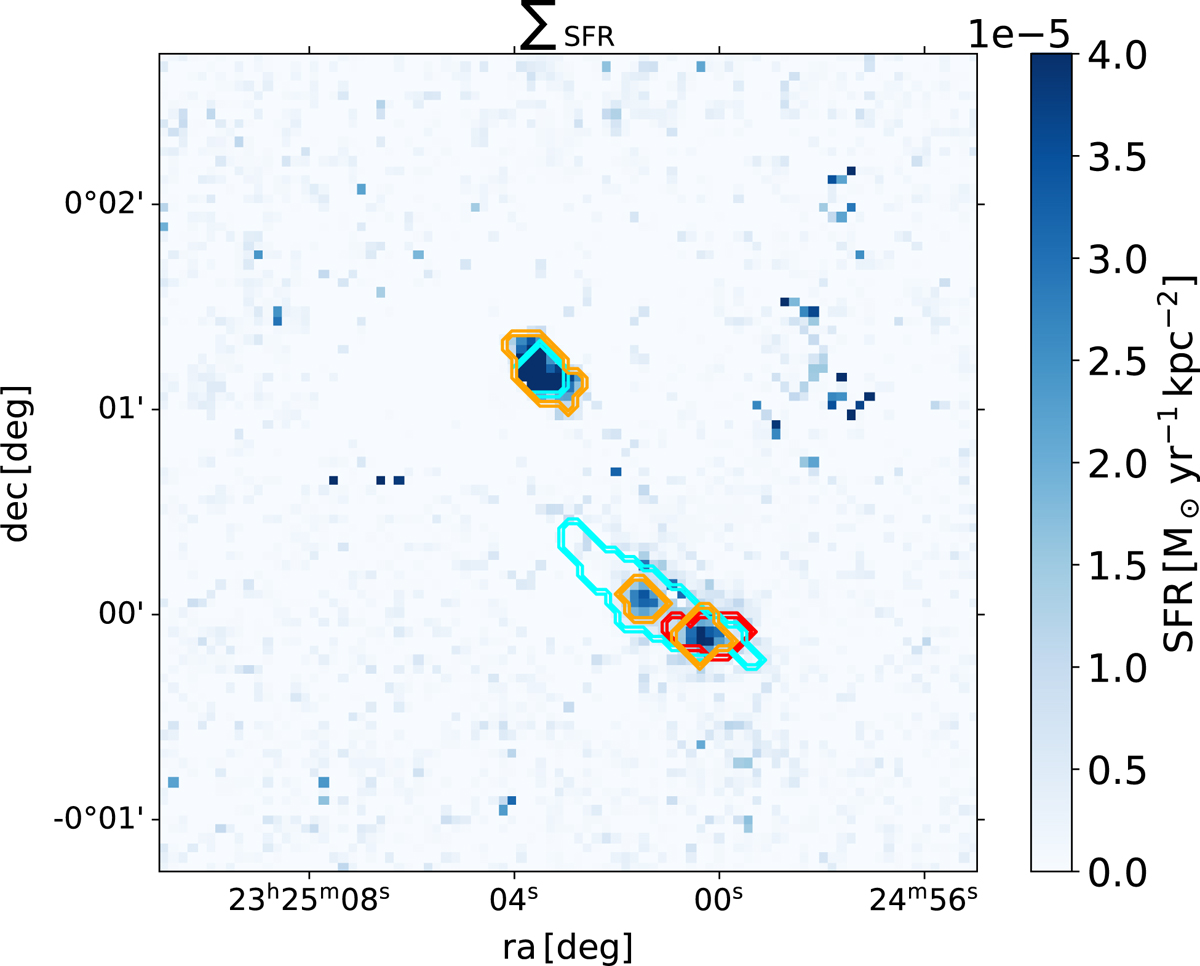
Download original image
Star formation rate surface density (∑SFR) map obtained for the isolated triplet SIT 45 in a 4 arcmin2 FoV. North is up, east is left. Coordinates are given in J2000. The colour bar is normalised to show the mean value for all the pixels within 5σ. Orange contours correspond to the mask defined on the ∑SFR map using astrodendro. For ease of comparison, the contours corresponding to the A galaxy (red contour) and the B and C galaxies (cyan contours) are shown. White contours were defined as astrodendro masks on a high-resolution three-colour (g, r, i) image from the HSC of the Subaru telescope (Aihara et al. 2022) of SIT 45 (as shown in Fig. 1). The red contour corresponding to the A galaxy selected using the GALEX FUV image (as shown in the upper left panel of Fig. 2).
Current usage metrics show cumulative count of Article Views (full-text article views including HTML views, PDF and ePub downloads, according to the available data) and Abstracts Views on Vision4Press platform.
Data correspond to usage on the plateform after 2015. The current usage metrics is available 48-96 hours after online publication and is updated daily on week days.
Initial download of the metrics may take a while.