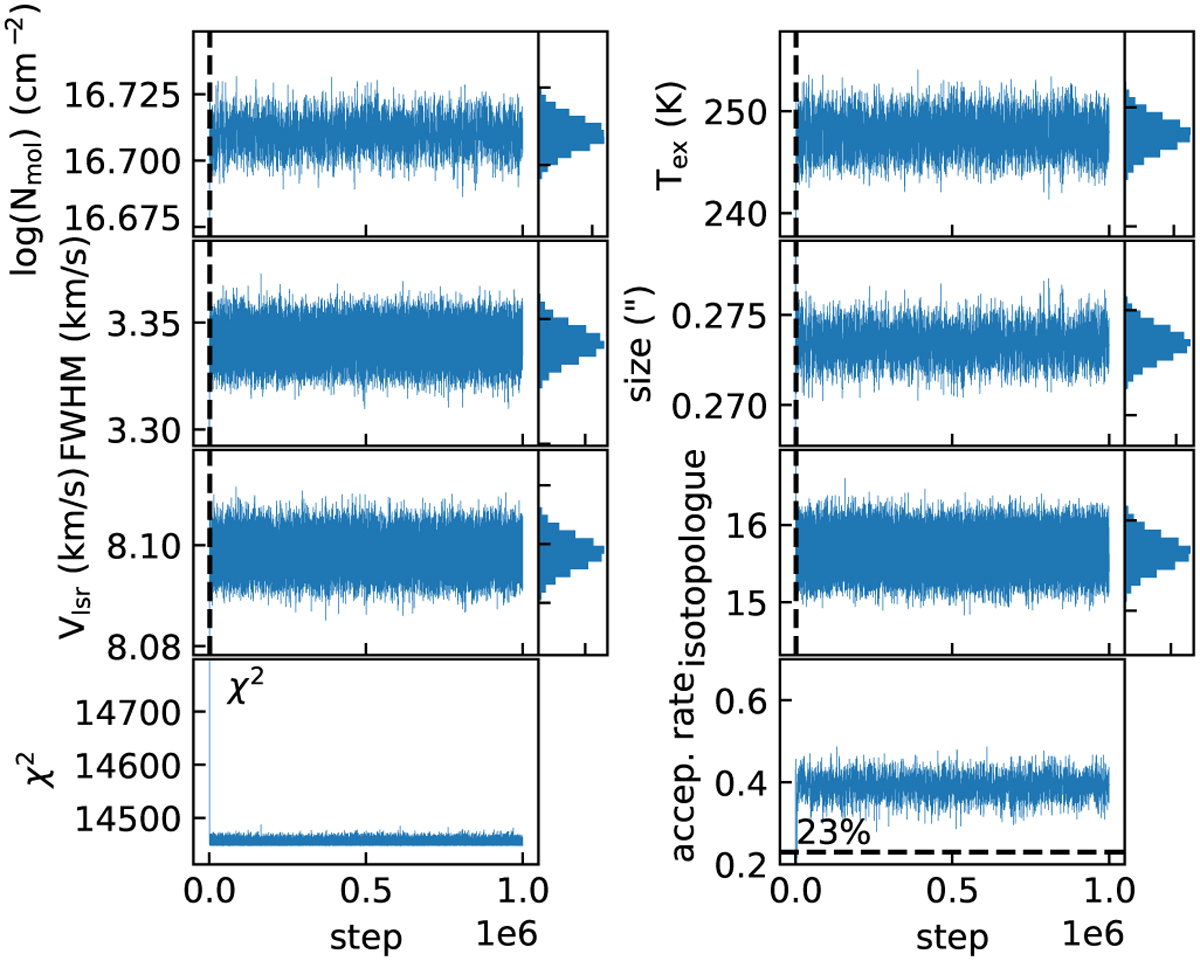
Fig. A.1
Download original image
Trace plot of the MCMC fitting for the LTE 1-component model. Each panel is for one physical parameter, for which the panel “isotopologue” is the column density ratio ![]() . The vertical dashed line represents the cut before which the data points are discarded and the histogram in the right is plotted based on the saved sample. The bottom panels show the χ2 derived by CASSIS and acceptance rate measured in every 300 steps.
. The vertical dashed line represents the cut before which the data points are discarded and the histogram in the right is plotted based on the saved sample. The bottom panels show the χ2 derived by CASSIS and acceptance rate measured in every 300 steps.
Current usage metrics show cumulative count of Article Views (full-text article views including HTML views, PDF and ePub downloads, according to the available data) and Abstracts Views on Vision4Press platform.
Data correspond to usage on the plateform after 2015. The current usage metrics is available 48-96 hours after online publication and is updated daily on week days.
Initial download of the metrics may take a while.