Open Access
Fig. 8
Download original image
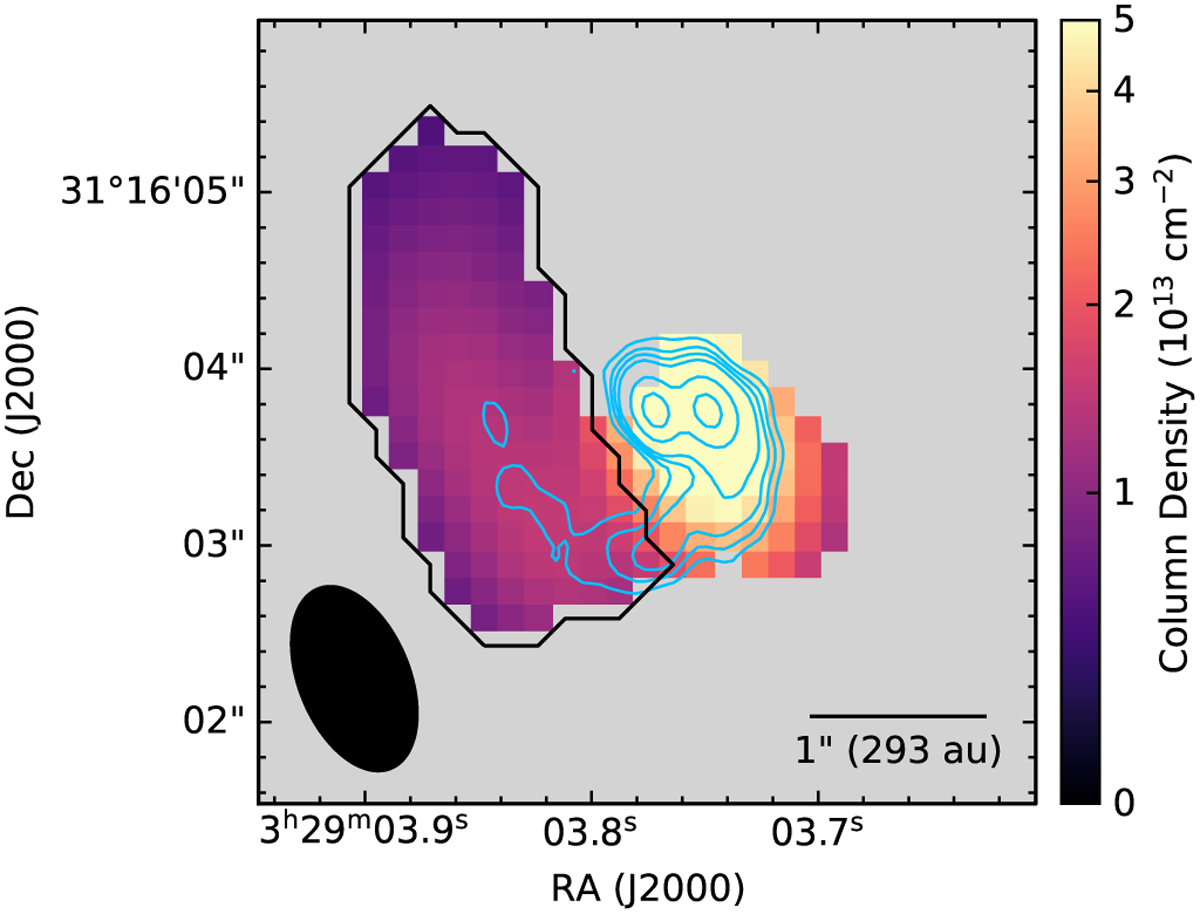
DCN column density map. The blue contours represent the ALMA 1.3 mm dust continuum emission. The black polygon encloses the area that is used to measure the mass of the streamer.
Current usage metrics show cumulative count of Article Views (full-text article views including HTML views, PDF and ePub downloads, according to the available data) and Abstracts Views on Vision4Press platform.
Data correspond to usage on the plateform after 2015. The current usage metrics is available 48-96 hours after online publication and is updated daily on week days.
Initial download of the metrics may take a while.