Fig. 6
Download original image
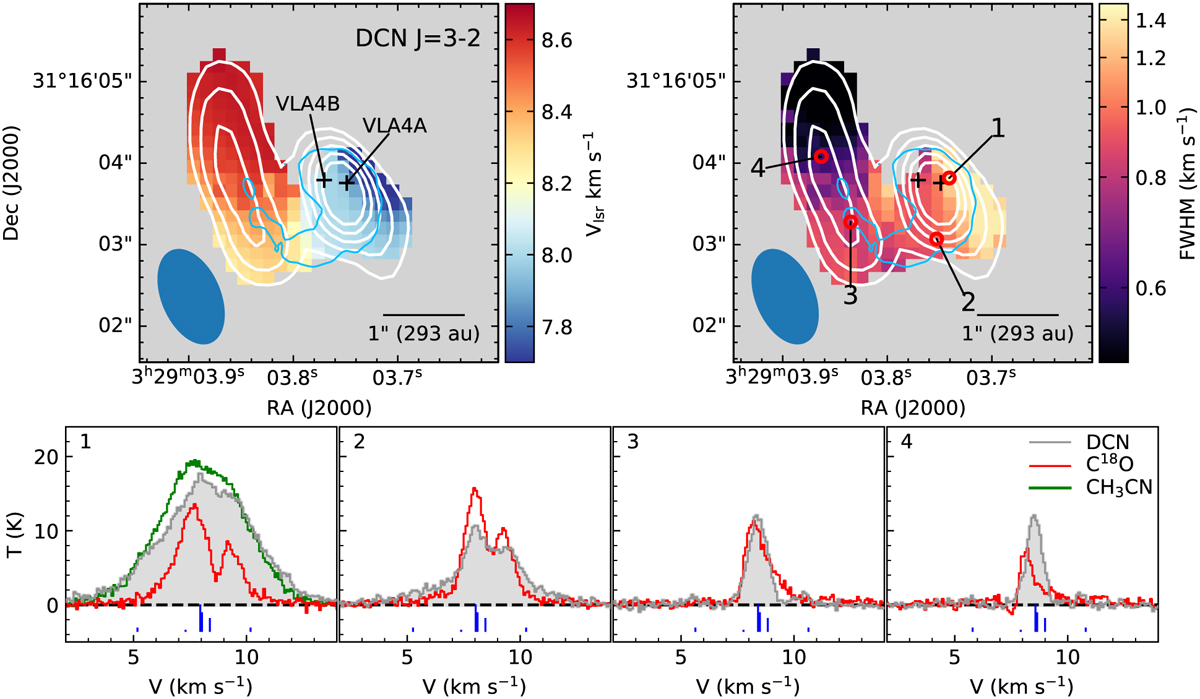
DCN (3–2) centroid-velocity (top-left) and linewidth (top-right) maps from the blueshifted component in the hyperfine structure fitting (see Appendix D). The white contours show its peak intensity. The contour levels start at 25σ and increase in 5σ step, where σ = 0.3 K. The blue contour shows the ALMA 1.3 mm continuum emission at the 3σ level. Spectra of DCN (3–2), C18O (2–1), and CH3CN (123–113) toward the four positions marked in the right panel (bottom). The blue bars show the relative intensities of the DCN (3–2) hyperfine structure at the velocity of the blueshifted component (see Appendix D).
Current usage metrics show cumulative count of Article Views (full-text article views including HTML views, PDF and ePub downloads, according to the available data) and Abstracts Views on Vision4Press platform.
Data correspond to usage on the plateform after 2015. The current usage metrics is available 48-96 hours after online publication and is updated daily on week days.
Initial download of the metrics may take a while.