Fig. 3
Download original image
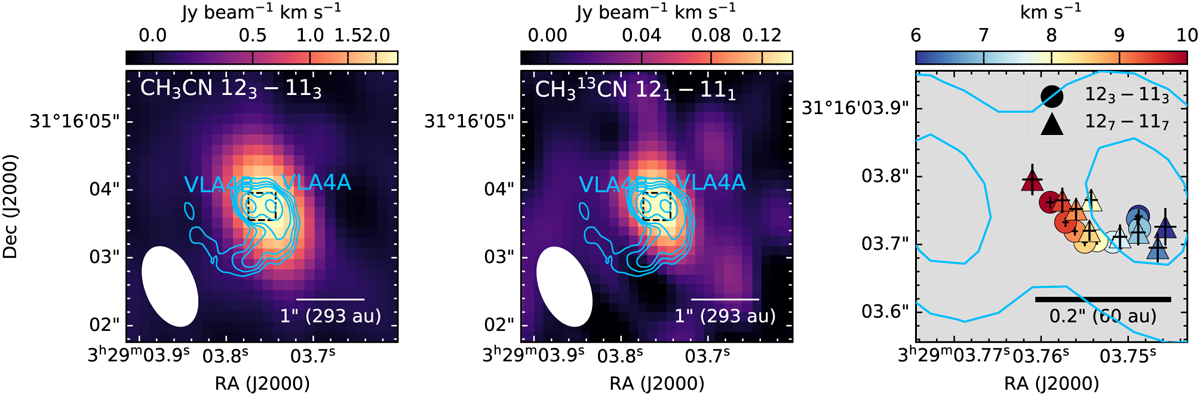
Integrated intensity map of CH3CN 123–113 emission (4.0–12.0 km s−1) shown to the left. The contours represent the ALMA 1.3 mm continuum emission from Fig. 1. with levels of 3σ, 5σ, 7σ, 10σ, 30σ, and 70σ. The dashed box shows the field of view in the right panel. The central panel shows the same details as the left, but for CH313CN 121–111 emission. Gaussian centers from the uυ-domain fitting shown on the right. The colored circles (CH3CN 123–113) and triangles (CH3CN 127–117) show the positions from the uv-domain fitting, with the color indicating the velocity.
Current usage metrics show cumulative count of Article Views (full-text article views including HTML views, PDF and ePub downloads, according to the available data) and Abstracts Views on Vision4Press platform.
Data correspond to usage on the plateform after 2015. The current usage metrics is available 48-96 hours after online publication and is updated daily on week days.
Initial download of the metrics may take a while.