Fig. D.1
Download original image
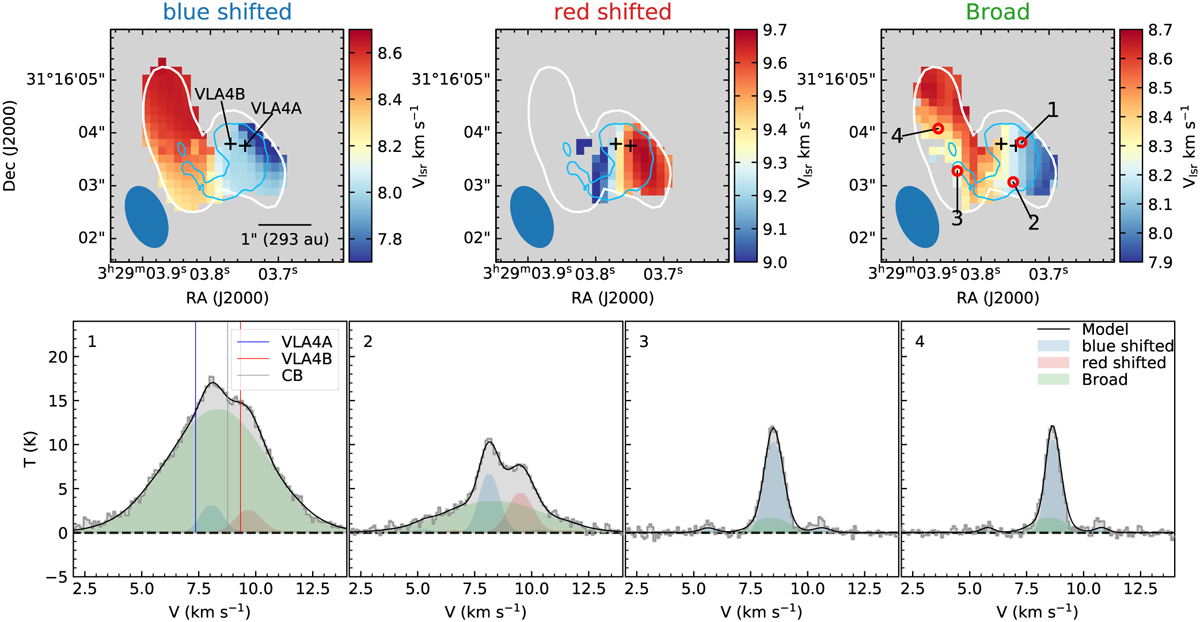
DCN (3-2) centroid-velocity maps of the three velocity components from the hyperfine structure fitting, shown at the top. The white contour shows the peak intensity above 25σ. The blue contour shows the ALMA 1.3 mm continuum emission at the 3σ level. Below, we have the spectra of DCN (3-2) with the hyperfine structure fitting toward the four positions marked in the top right panel. The three vertical lines represent the systemic velocites of VLA4A, VLA4B, and the circumbinary disk from Diaz-Rodriguez et al. (2022).
Current usage metrics show cumulative count of Article Views (full-text article views including HTML views, PDF and ePub downloads, according to the available data) and Abstracts Views on Vision4Press platform.
Data correspond to usage on the plateform after 2015. The current usage metrics is available 48-96 hours after online publication and is updated daily on week days.
Initial download of the metrics may take a while.