Open Access
Fig. C.2
Download original image
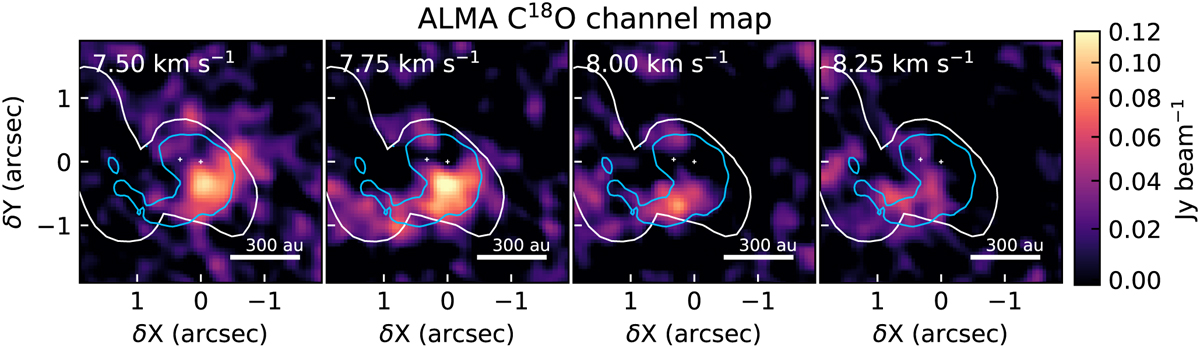
ALMA C18O channel map. The blue contour shows the ALMA continuum emission at 3σ and the white contour shows the DCN (3-2) peak intensity map at 25σ.
Current usage metrics show cumulative count of Article Views (full-text article views including HTML views, PDF and ePub downloads, according to the available data) and Abstracts Views on Vision4Press platform.
Data correspond to usage on the plateform after 2015. The current usage metrics is available 48-96 hours after online publication and is updated daily on week days.
Initial download of the metrics may take a while.