Open Access
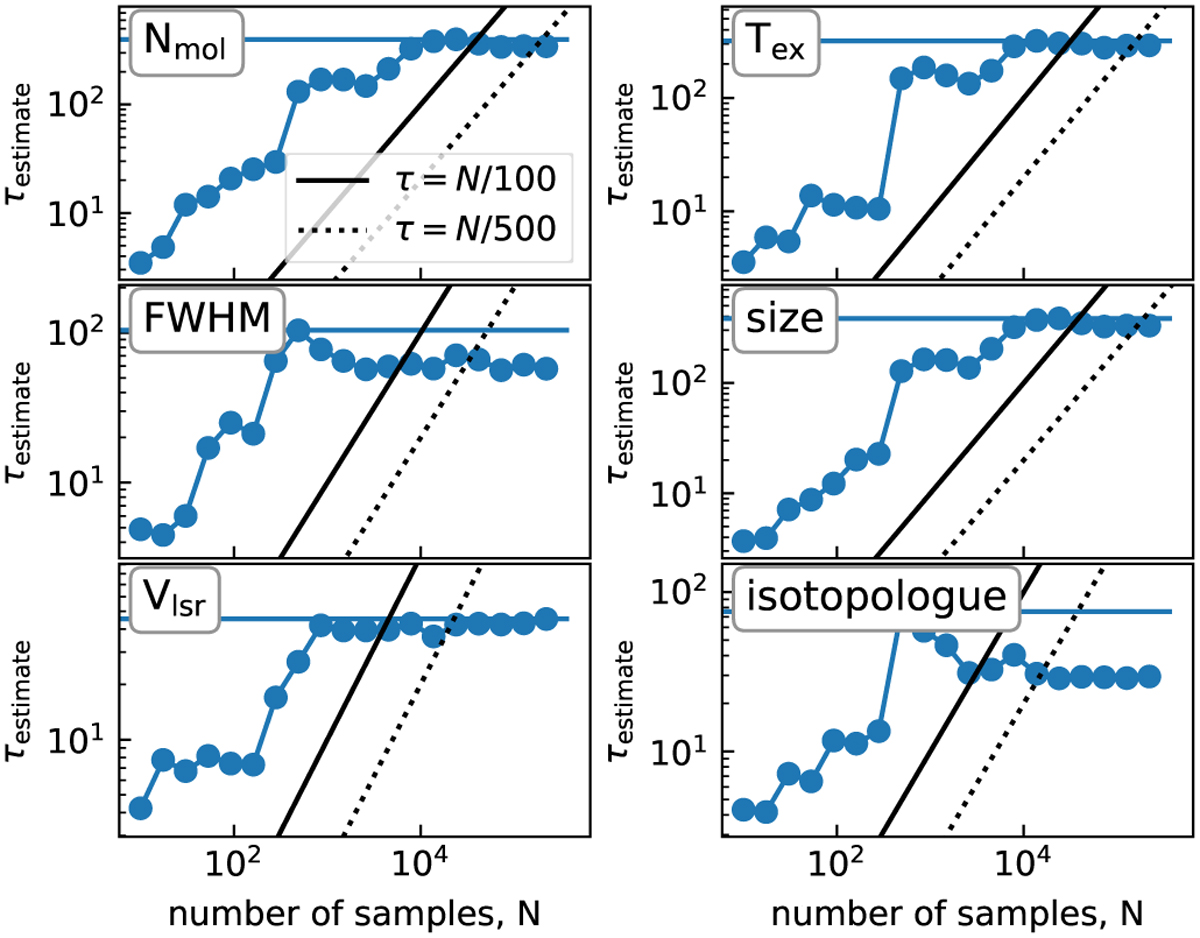
Fig. A.2
Download original image
Autocorrelation time as a function of number of samples for estimation for the LTE 1-component model in the MCMC fitting. The horizontal line represents the maximal autocorrelation time (τ), and the solid and dashed lines represent the number of sample with 50 and 500 times of τ.
Current usage metrics show cumulative count of Article Views (full-text article views including HTML views, PDF and ePub downloads, according to the available data) and Abstracts Views on Vision4Press platform.
Data correspond to usage on the plateform after 2015. The current usage metrics is available 48-96 hours after online publication and is updated daily on week days.
Initial download of the metrics may take a while.