Fig. 9.
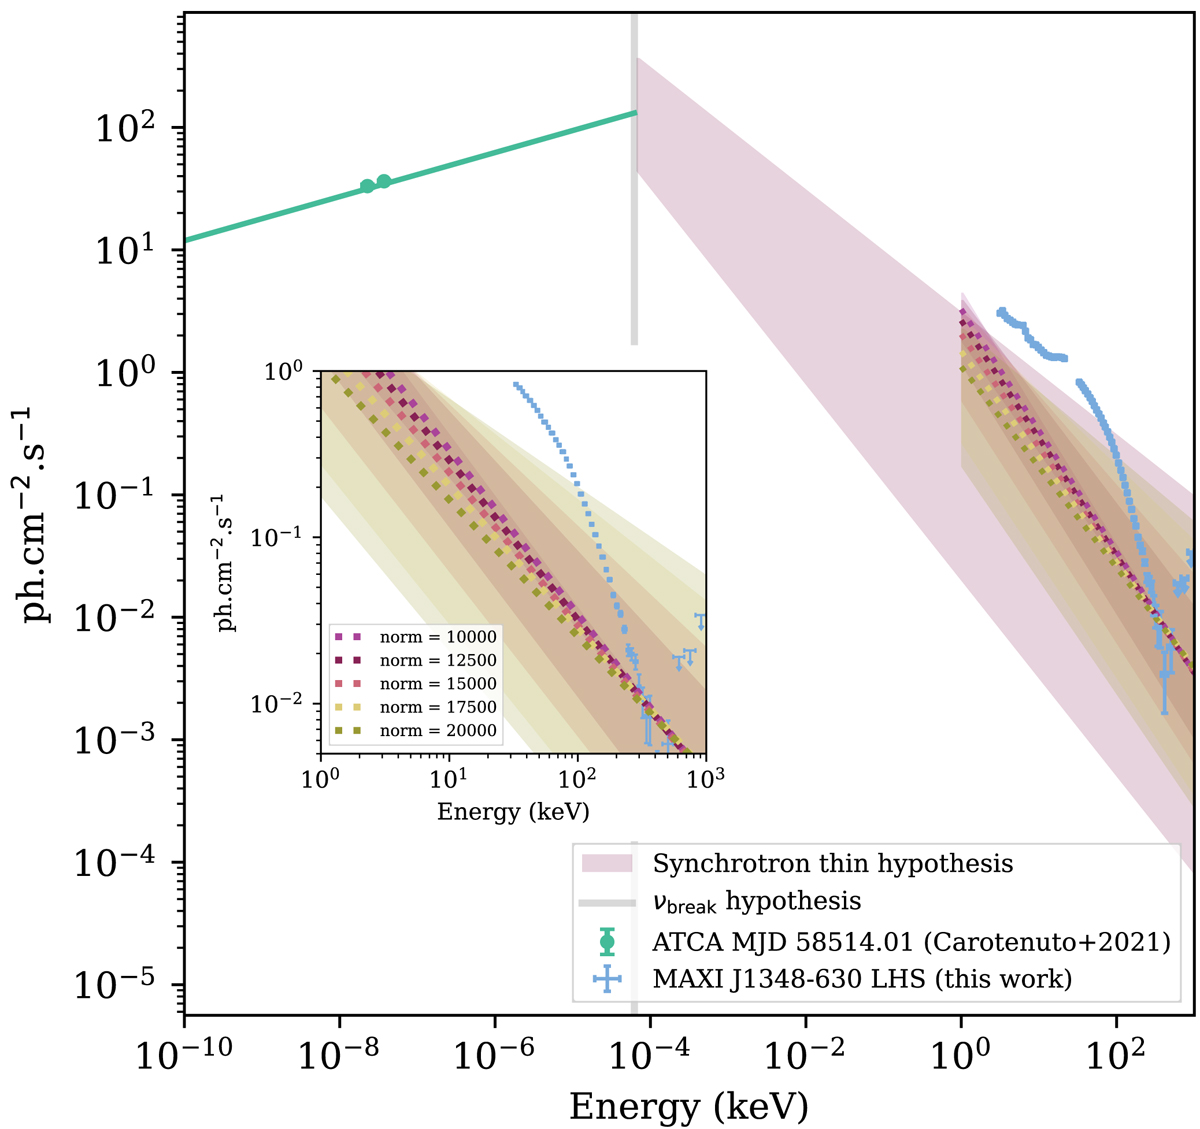
Download original image
Broadband spectrum of MAXI J1348−630. The light-blue line is the spectrum as measured by Carotenuto et al. (2021). The green zone corresponds to our synchrotron thin spectrum hypothesis (see the text). The insert plot focuses on the 1–1000 keV range. The different colors indicate the resulting power law for different normalization values of the DISKBB.
Current usage metrics show cumulative count of Article Views (full-text article views including HTML views, PDF and ePub downloads, according to the available data) and Abstracts Views on Vision4Press platform.
Data correspond to usage on the plateform after 2015. The current usage metrics is available 48-96 hours after online publication and is updated daily on week days.
Initial download of the metrics may take a while.